# Build and Deploy IMDB NLP model
This tutorial will help you to get to know the cnvrg platform and show you how cnvrg helps you build and organize machine learning projects.
Using a real-world case, we will briefly go through the platform from end to end -- from data loading and tagging, to researching and experimentation to deploying models as REST APIs.
We will be specifically covering the following features of cnvrg:
- Creating a project
- Creating a dataset
- Running an experiment
- Running a grid search
- Publishing a model
- Conducting A/B testing on a live endpoint
NOTE
This tutorial is focussed on the web UI. See the mnist tutorial for a tutorial focussing on the cnvrg CLI.
# Registration and Installation
cnvrg comprises two main modules:
- An intuitive Web interface where you can track, manage, and build machine learning projects and datasets.
- A powerful CLI. cnvrg CLI helps you to sync your local dev environment to cnvrg cloud and enjoy powerful features.
To install the cnvrg CLI, please use the following guide.
In this tutorial, we will focus more on using the Web interface, but everything can be accomplished through the CLI as well!
# About IMDB
In this example, we’ll be training a text classification model using the IMDB dataset, which is a set of 50,000, highly polarized reviews from the Internet Movie Database.
The model will be a simple binary classification model and if all goes according to plan, should be able to accept a review and tell if it is a ‘positive’ or ‘negative’ review.
Our dataset has already been preprocessed and the written reviews translated into integers, where each integer corresponds with a word in a dictionary.
# Setting up the dataset
Usually, we would import a dataset before beginning to work on the Project. However, in this case, we will be using Keras to download the dataset within the project.
# Getting the project started
On the website, navigate to the Projects tab.
Welcome to the home of your code, experiments, flows and deployments. Here everything lives and works together.
For this example, we’ll use the prebuilt example project. On the top right, click Example Projects.
Select Text Classification with Keras and IMDB dataset.
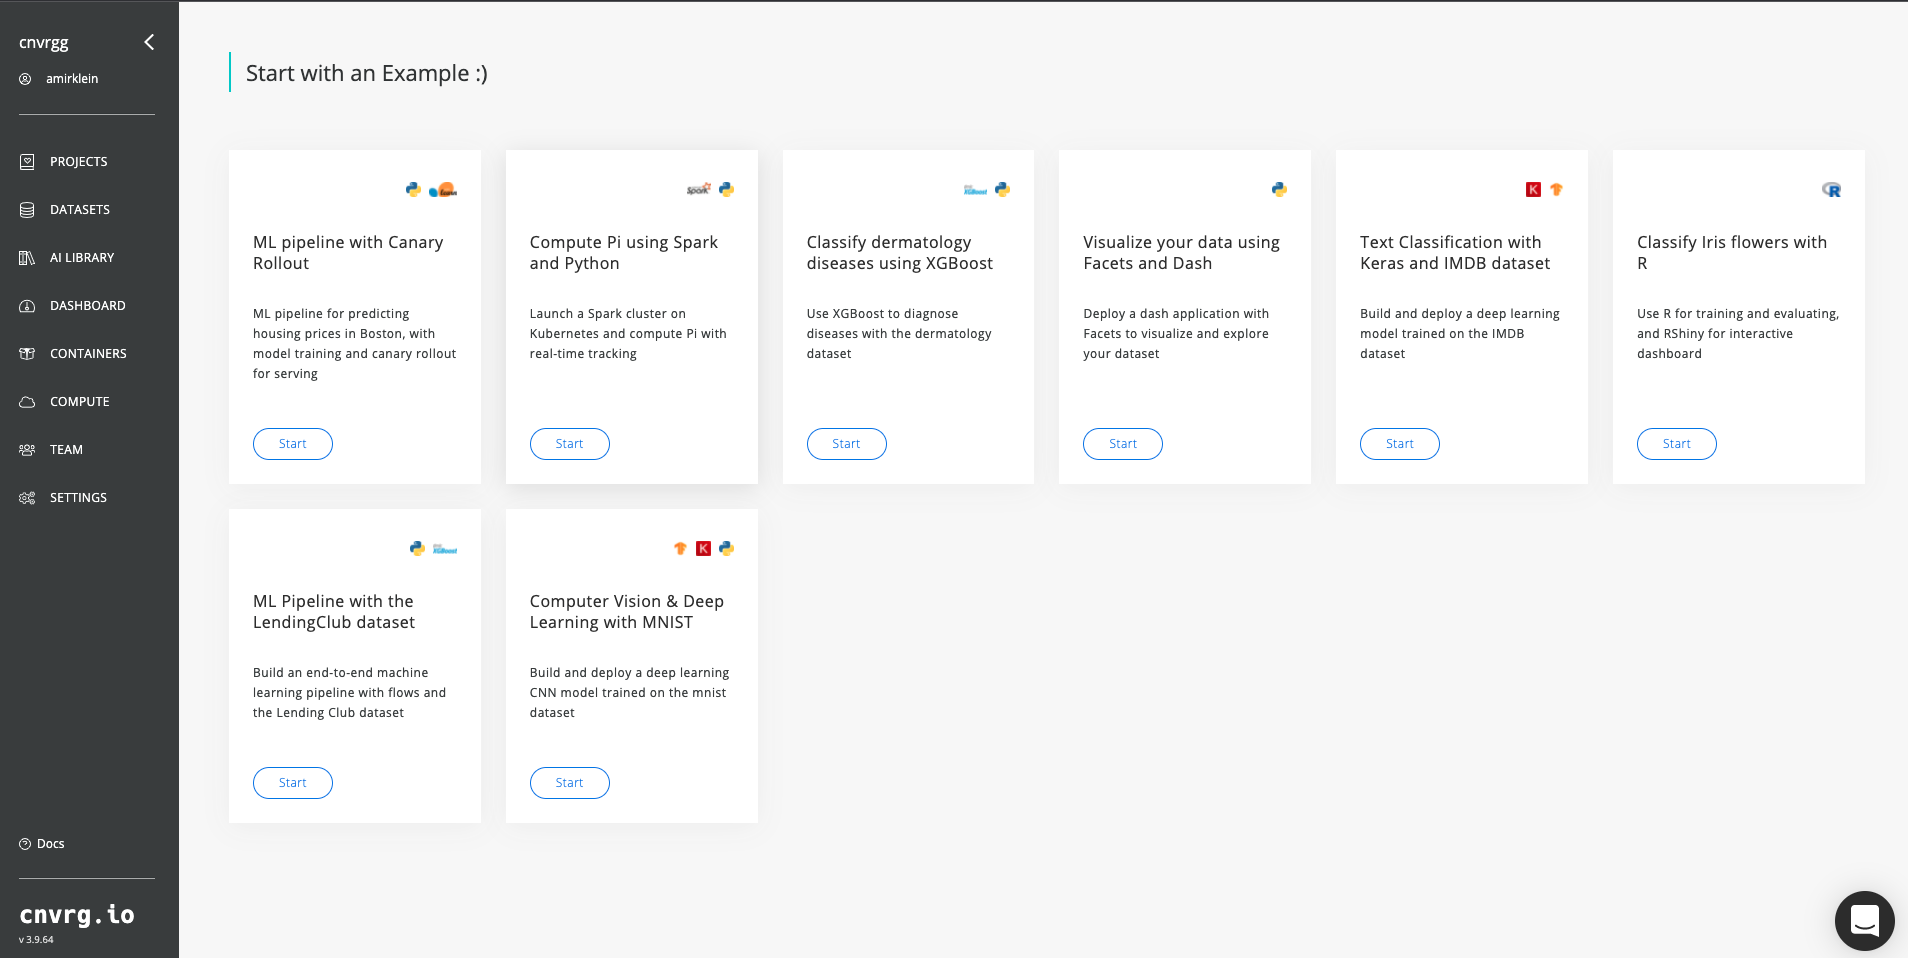
Now you’ve created a cnvrg project titled imdb. The imdb project dashboard is displayed. Let’s have a closer look at what’s inside the project and files.
# Launching a Jupyter Workspace
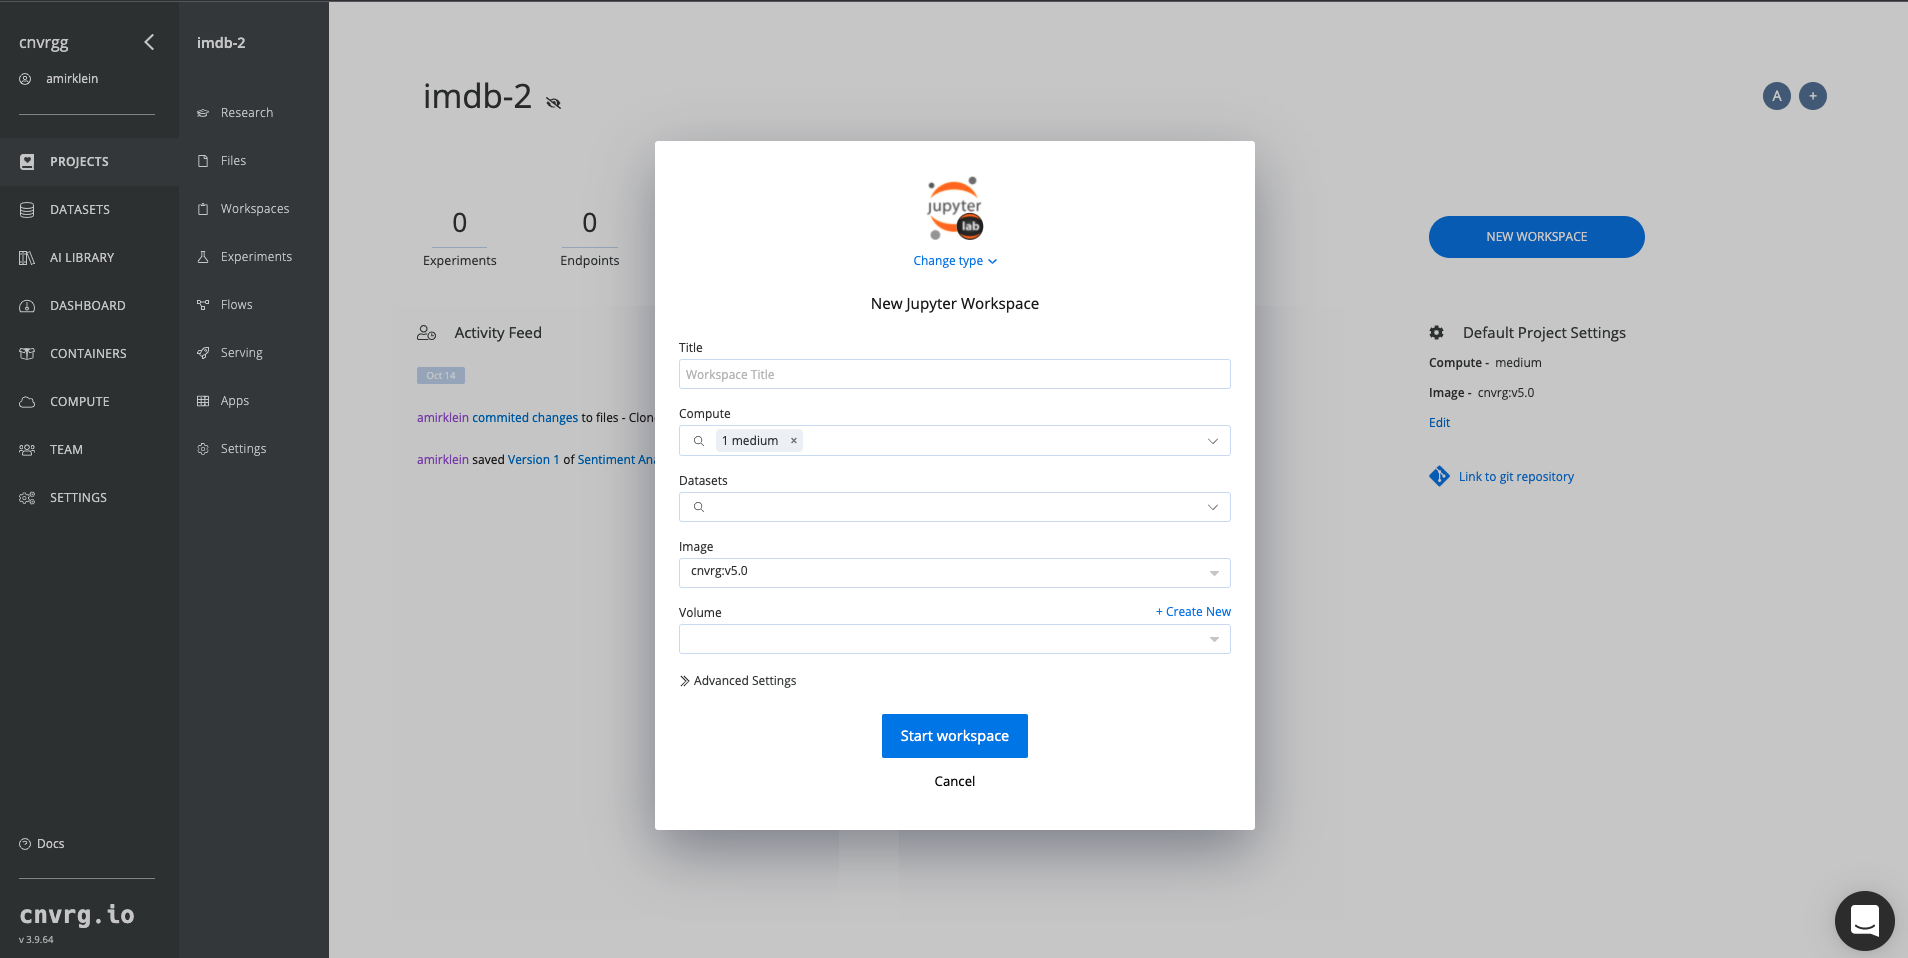
On the current page, click the New Workspace.
TIP
You can always make new workspaces through the Workspaces tab on the sidebar.
Now let’s fill in this form to get our Jupyter workbook up and running. By default, the workspace type is Jupyter lab. If you wanted to use another workspace type, for example, R Studio or VSCode which can be chosen from the Change type list. Fill in a title of your choice and select large in the Compute window. Click Start Workbook.
cnvrg will now put everything into motion and get a Jupyter Lab workspace up and running for us to use. It may take a few moments but soon enough, everything will be ready to go.
This is how it looks:

With the notebook, you can run code and play around with your data to better design your models. You can also open and edit your code. For example, we can open train.py and have a look at the code that our example project has provided. Any changes you make will be committed using cnvrg’s built-in version management.
# Model Tracking and Visualization
One of cnvrg’s great features is Research Assistant. Using a simple print to stdout, Research Assistant lets cnvrg automatically track any metrics you want. You can then easily compare experiments and models later on.
The format is as follows:
(‘<cnrvg_tag_NAME>’, keyvalue)
Research Assistant will automatically keep track of these and present them to you for easy comprehension.
For example, click on the train.py file, and take a look at the added tags in the following code at the lines indicated:
Line 120:
print('cnvrg_tag_test_accuracy: ', results[1])
print('cnvrg_tag_test_loss: ', results[0])
These will provide us with accuracy and loss metrics in our model. You can customise those lines to any metrics you seem fit for your experiment.
Great! Let’s train our new model in an experiment.
TIP
Make sure you click Sync to keep the changes up to date!
# Experiments
Experiments are the core of every machine learning project. When building a model, it’s all about trying new ideas, testing new hypotheses, testing hyperparameters, and exploring different neural-network architecture.
At cnvrg, we help you to experiment 10x faster and get everything 100% reproducible and trackable, so you can focus on the important stuff.
An experiment is basically a “run” of a script, locally or remotely. Usually, to run an experiment on a remote GPU, you'd have to handle a lot before getting the actual results, and that includes: getting data, code, dependencies on the machine, SSH back-and-forth to see what’s new, and more. cnvrg completely automates that, and allows you to run an experiment with a single click.
# Running an experiment
On your project’s sidebar, click Experiments, then click New Experiment. In the panel that appears:
- For Command to Execute, type in or select
python3 train.py. - For Environment > Compute, select large.
- Click Run.
TIP
There are plenty of other options that you can use when running an experiment that enable powerful experiments for any use case. see here
Now cnvrg will get everything set up and start running the experiment. It might take a few minutes but on the experiment page you should be able to follow its progress live. You can view the output, graphs, and even see the tensorboard.
You should also notice towards the top, all our cnvrg tags being populated and tracked.
# Running hyperparameter optimization
Our single training experiment is now complete. It looks pretty good, but maybe if we changed some of our parameters we could end up with a stronger model. Let’s try a grid search to find out.
cnvrg has native support for running many different forms of hyperparameter optimization searches including grid-search, bayesian optimization and random forest. It requires to only have a few variables exposed as (python) arguments so cnvrg can automatically execute experiments with custom hyperparameters. This is doable by making a couple of changes to your code to customise it.
To see how to customise your hyper-search let's take a look at our train.py file. Go back into the workspace that we set up (if you closed it, launch a new workspace the same way we did before).
Now let's look at the following lines 24 and 25:
parser.add_argument('--epochs', help='number of epochs to run', default='10')
parser.add_argument('--batch_size', help='iteration batch size', default='128')
As well as 28 and 29:
batch_size = int(args.batch_size)
epochs = int(args.epochs)
Feel free to change the default epoch number and batch size to fit your specific model.
Once finish editing don't forget to save the file.
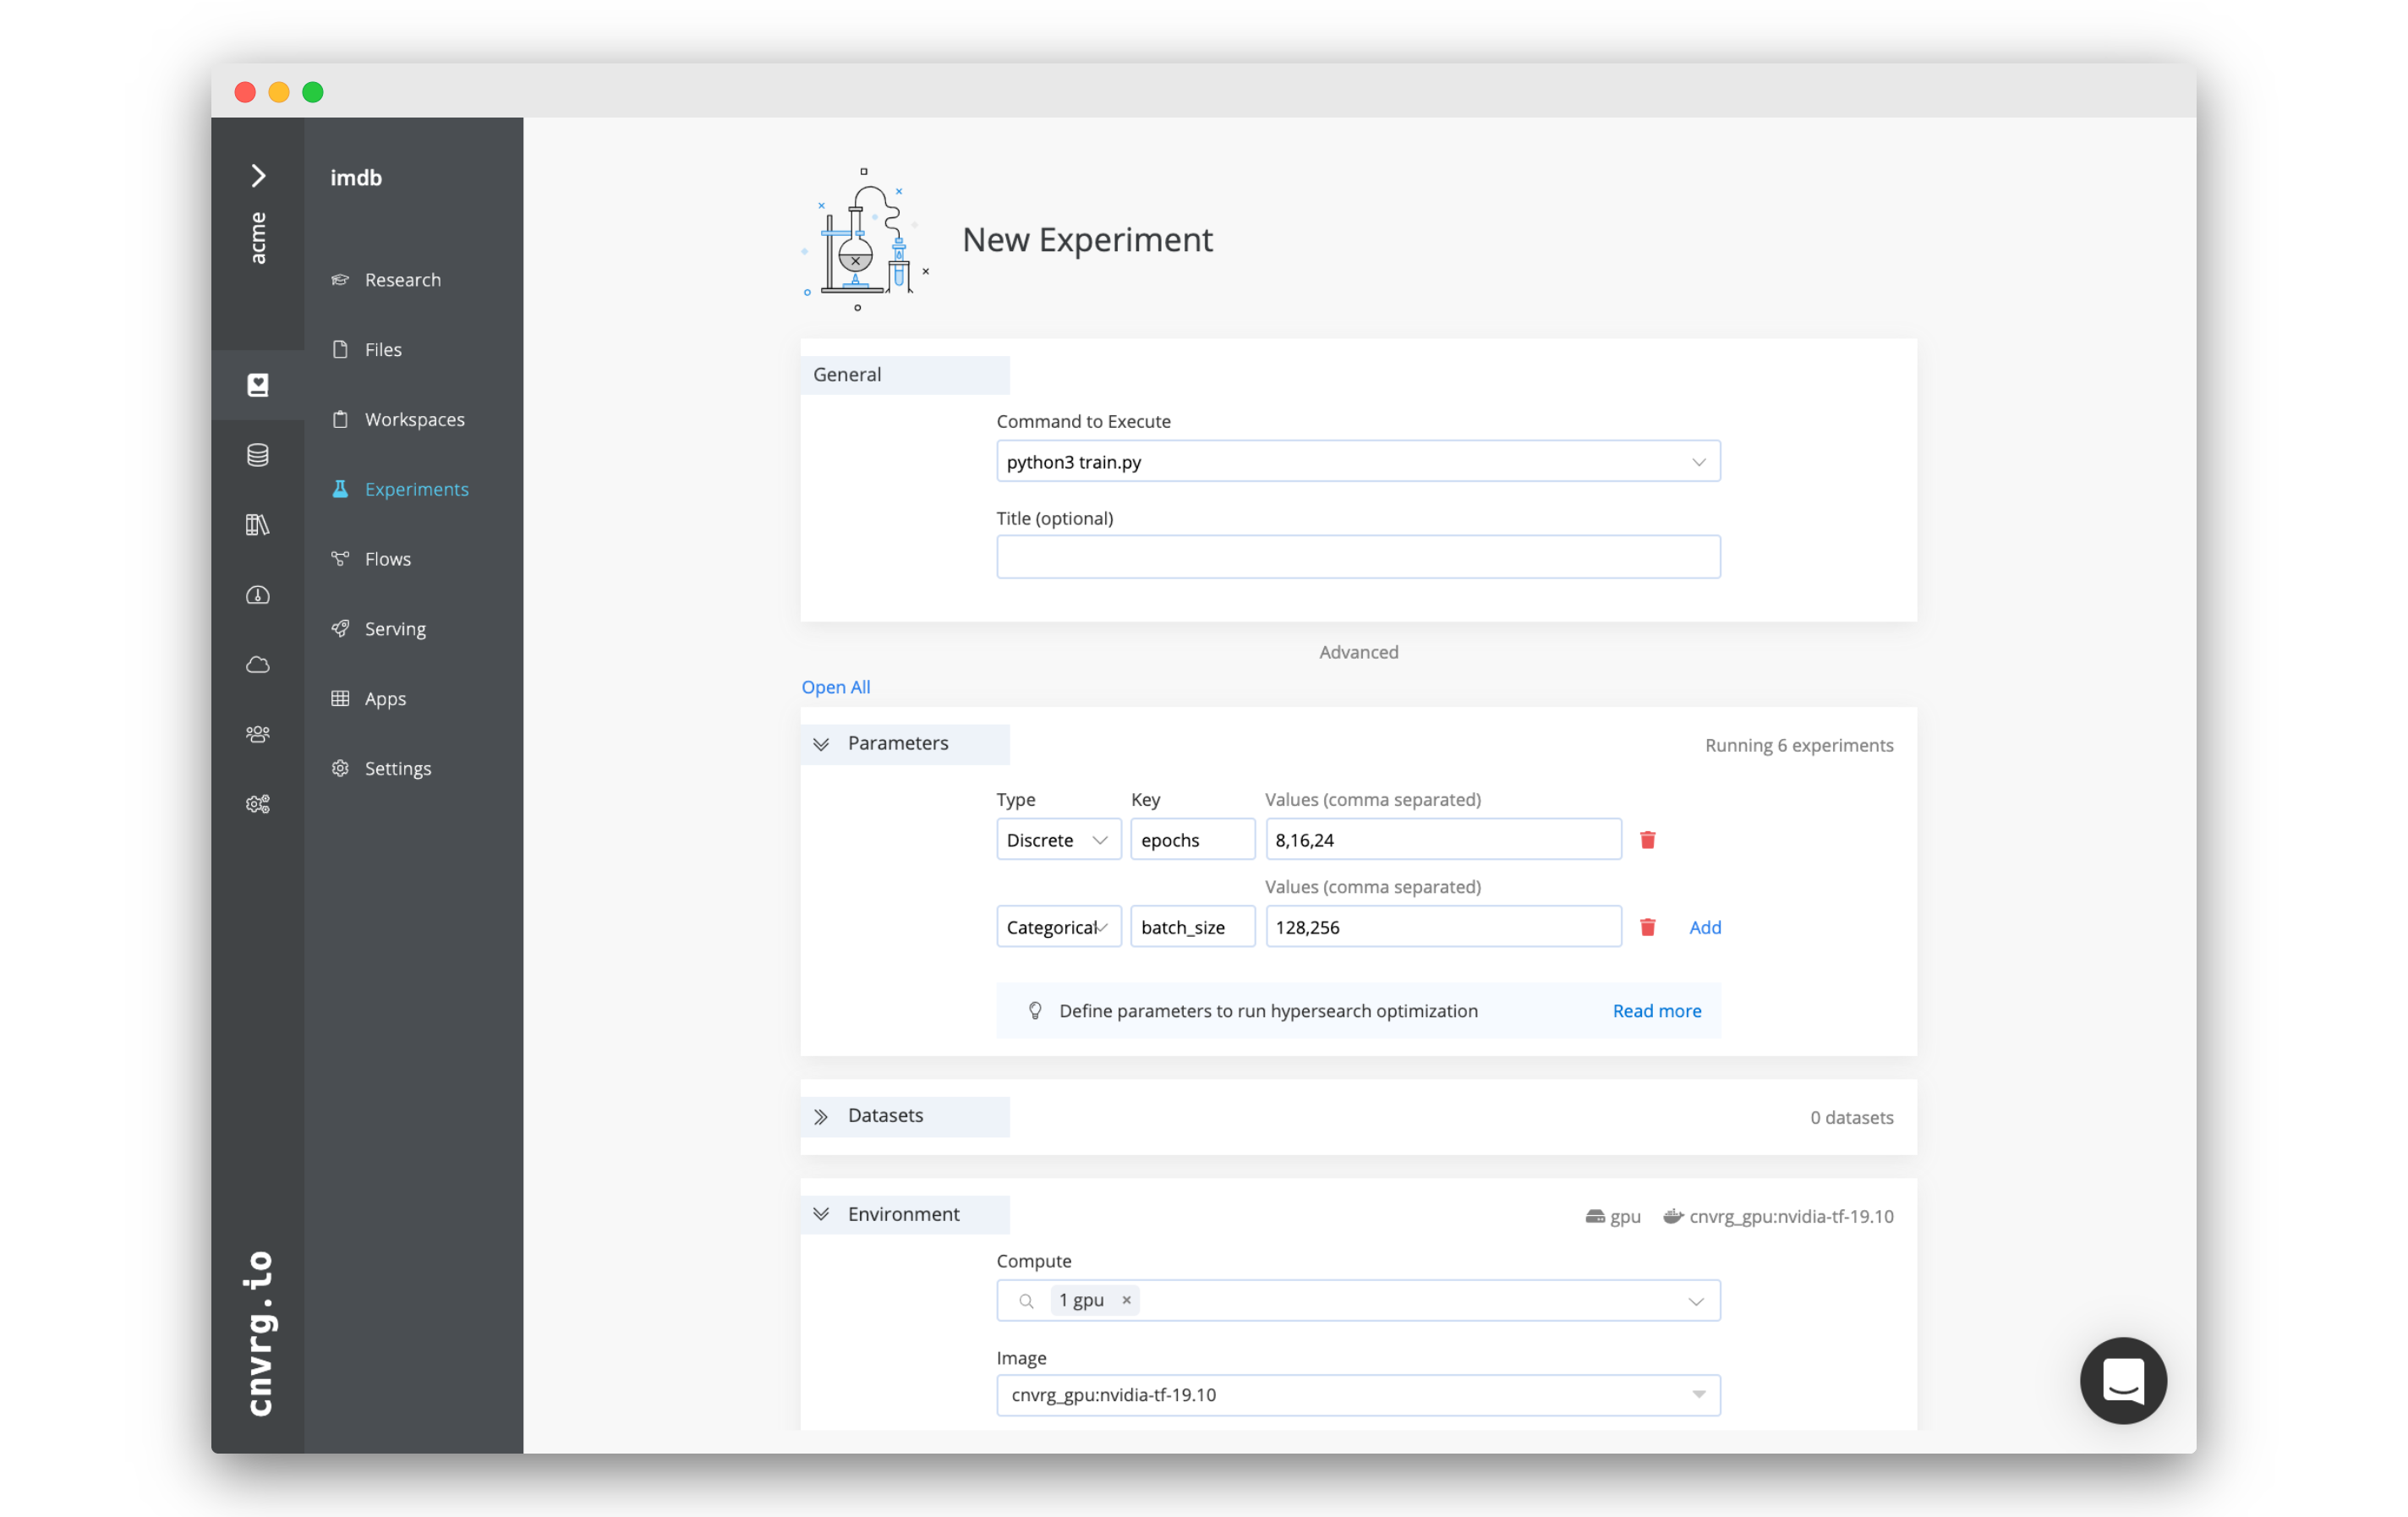
Go back to the Experiments tab. Click New Experiment. In the panel that appears:
- For Command to Execute, type in or select
python3 train.py. - Click on the Parameters subsection. We will now add two parameters for the grid search.
- Epochs:
- Type: Discrete
- Key: epochs
- Values: 6,8,10
- Batch Size (Click add to insert another parameter):
- Type: Categorical
- Key: batch_size
- Values: 64,128
- Epochs:
- Set Environment > Compute as large.
TIP
In this example we're using Grid-Seach optimization method. There are a few other options that can be used and can be selected in the Algorithm dropdown.
Click Run.
cnvrg will set up 6 discrete experiments and run them all using the hyperparameters as entered.
# Visualizing and comparing
After all of our experiments have run successfully, we can now compare and choose the best performing model. Cnvrg makes this really easy with the built-in visualization and comparison tools.
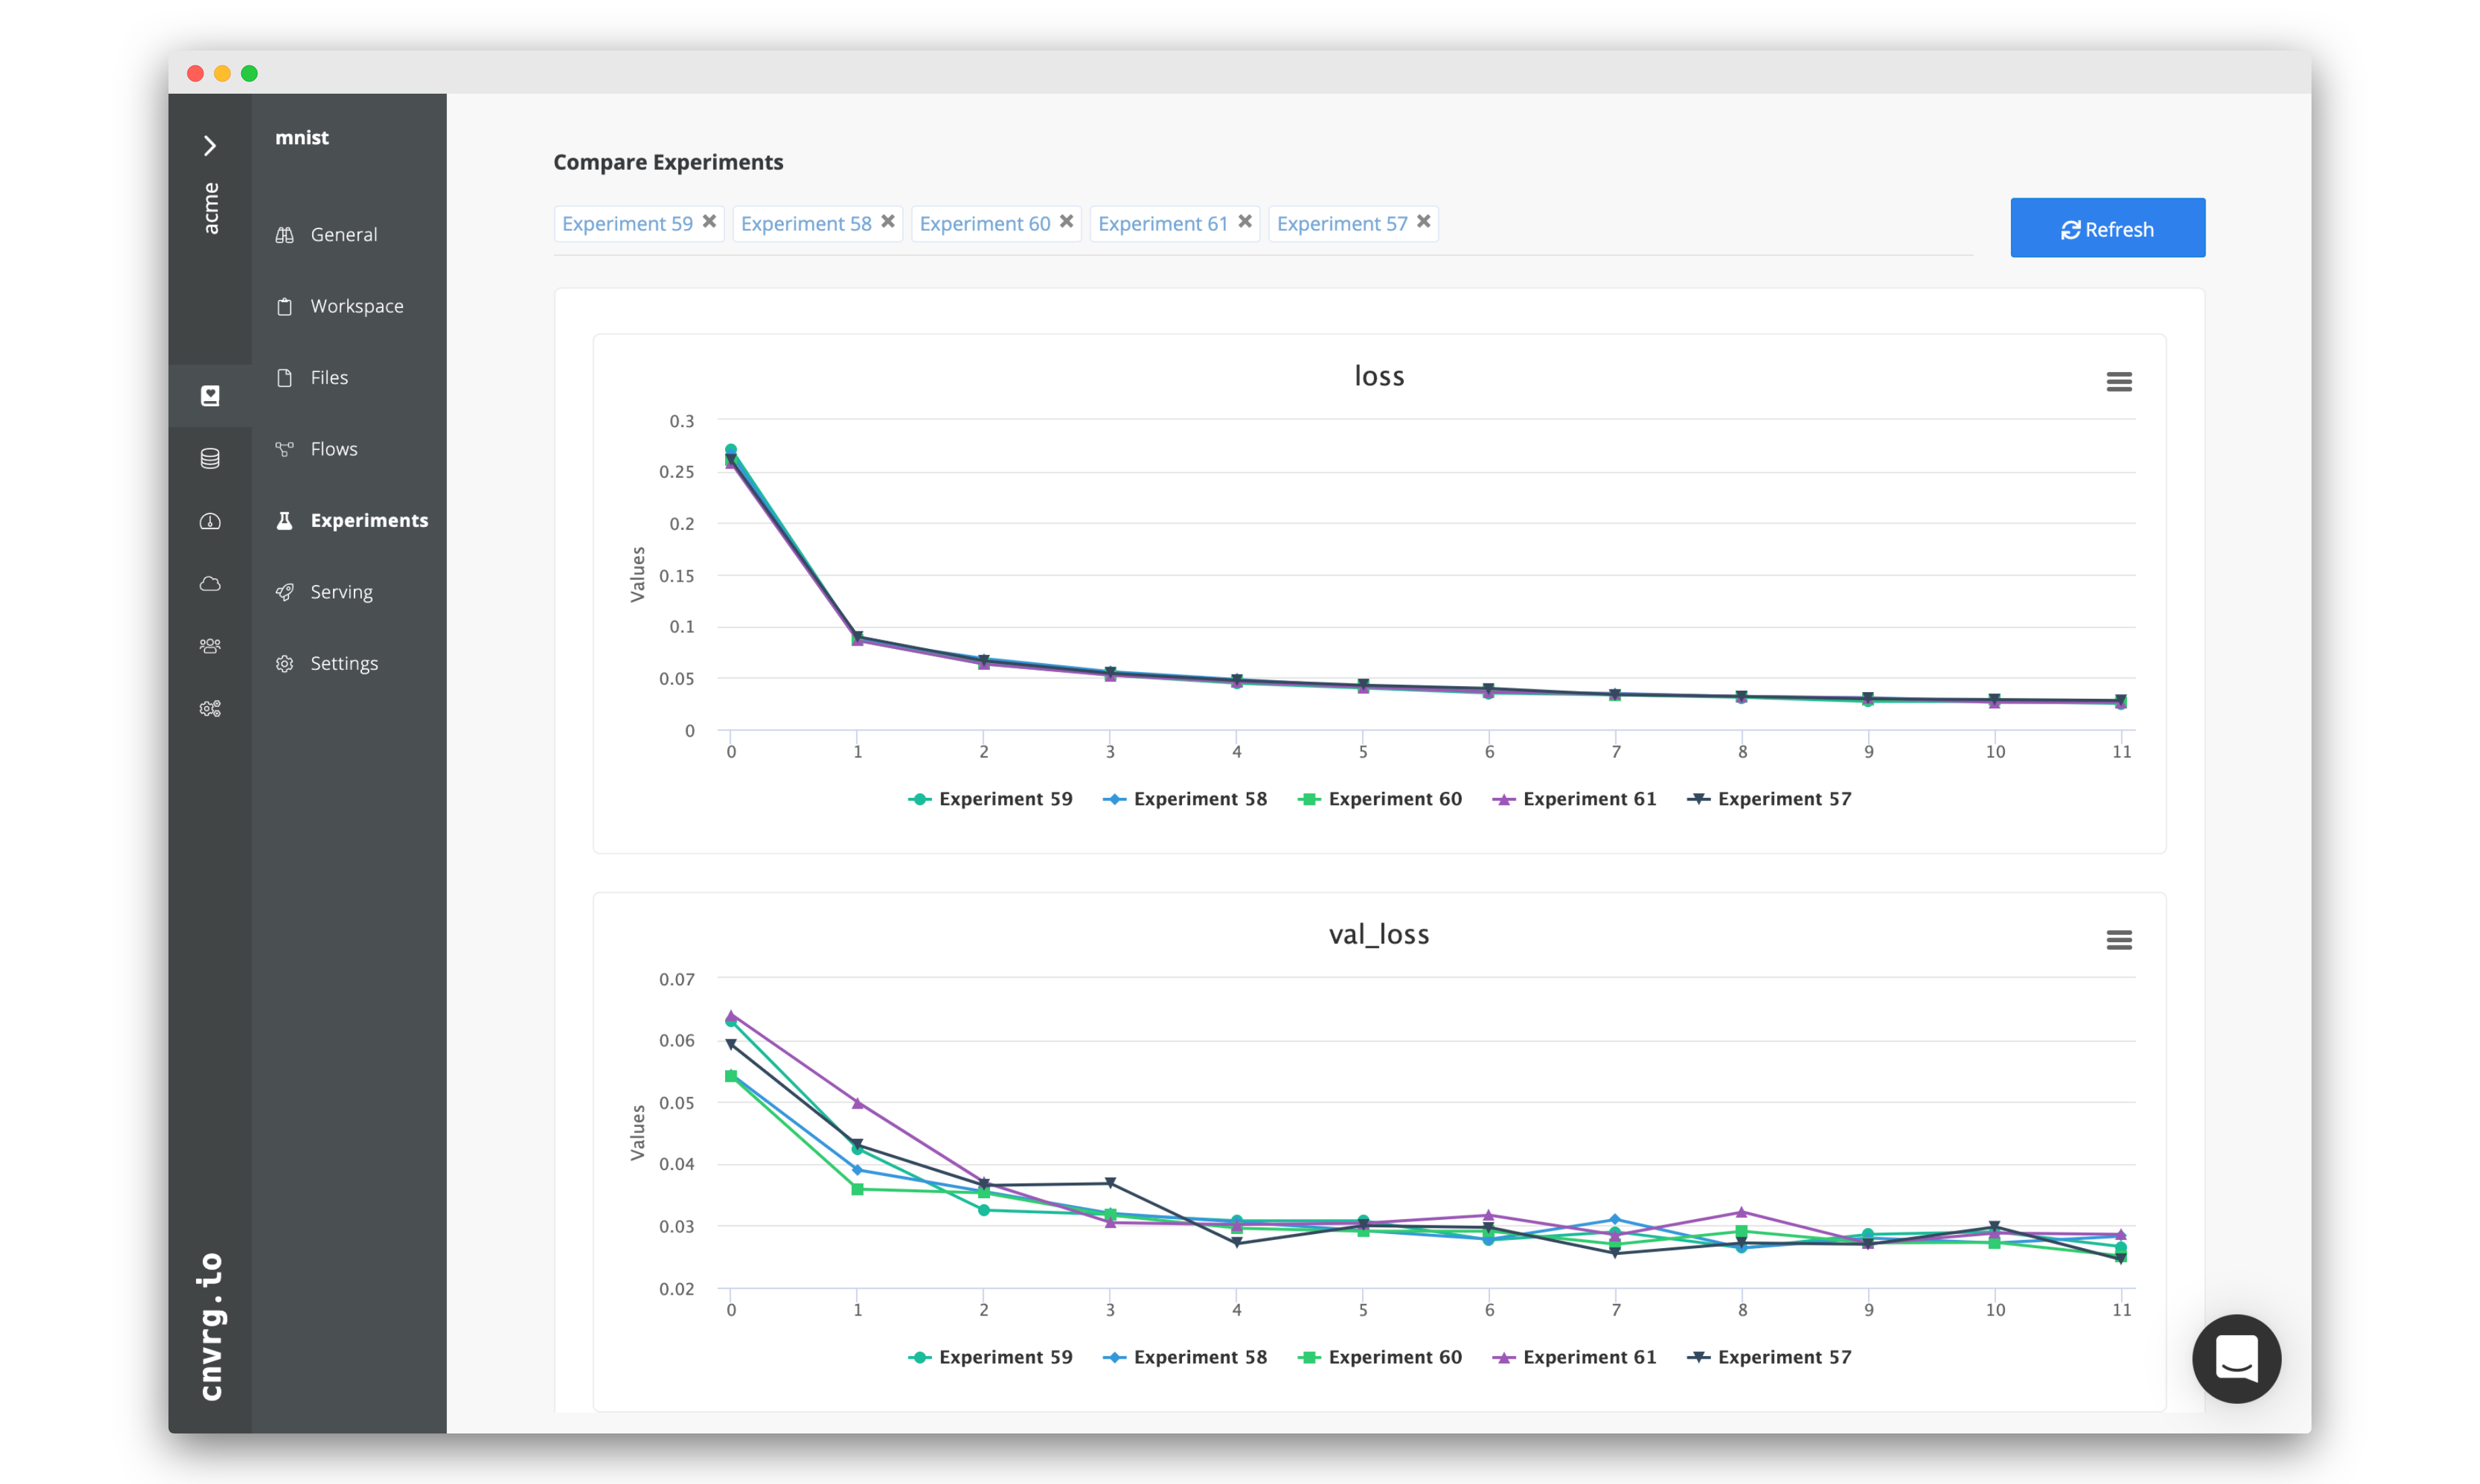
Navigate back to the Experiments page and select all the experiments we just ran as part of the grid search. At the top left select and click Compare in the drop-down menu.
Here we can see all the results and metrics of our experiments beautifully displayed together. It makes it easier to choose our most accurate model.
For example, click on any individual hyper-parameter experiment and go to the Config and Metrics tab. Here you can see the batch size and epochs as well as the metrics in which the model is experimenting (i.e. accuracy, loss). These metrics were modified as seen above in our code.
This is how it should look:

Once we’ve identified our favorite, we can put it into deployment!
# Deploying a model
Let’s deploy the model as a REST API:
Navigate to the Serving tab in your project.
Click Web Service.
The New Endpoint pane appears:
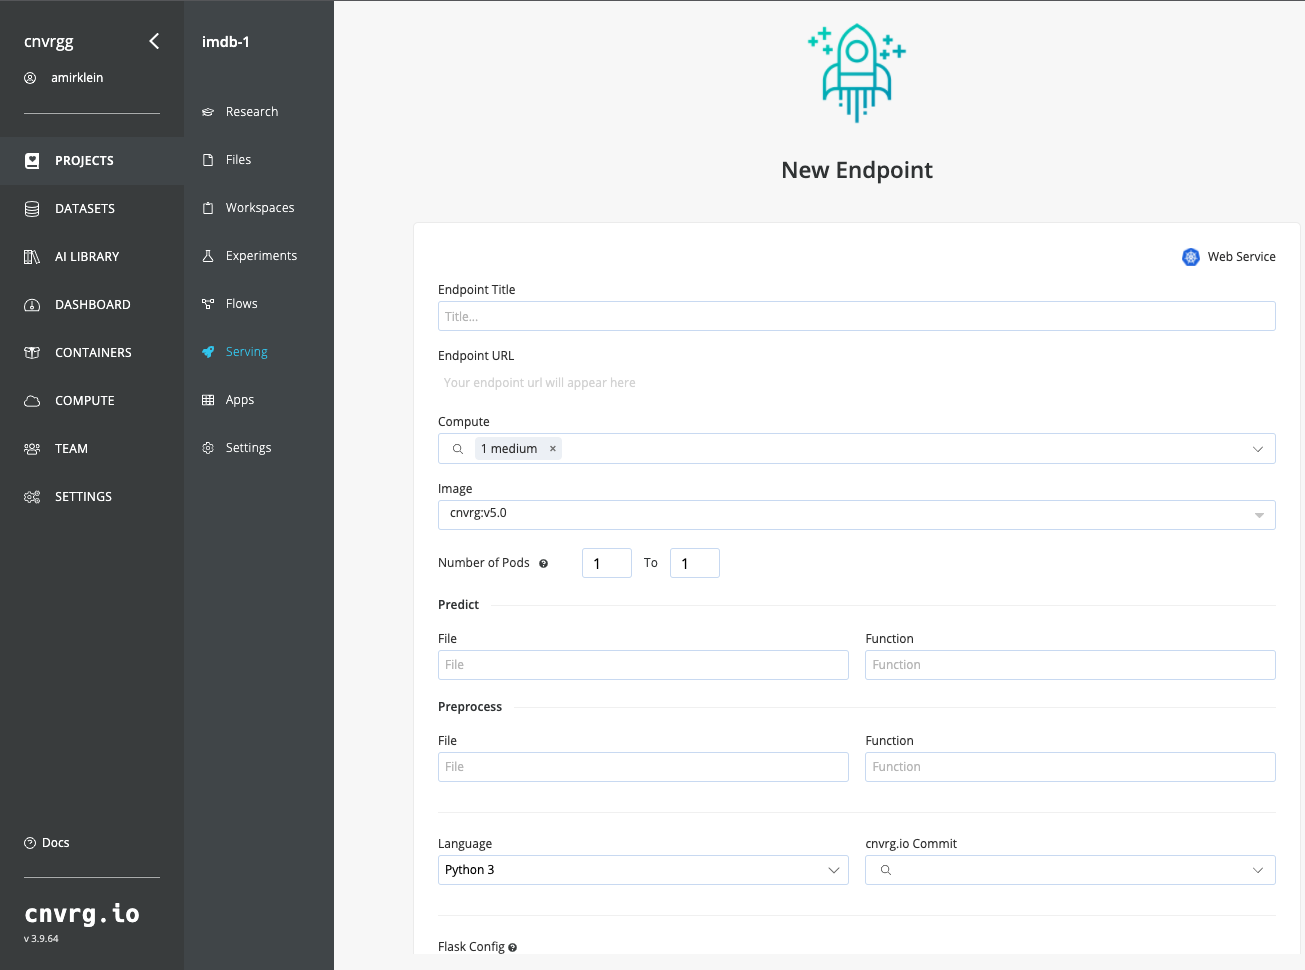
Provide details for the following fields:
- Title > Choose your own!
- Compute > Choose medium.
- File > In this case, select
predict.py. - Function > In this case, specify:
predict. - Commit > Make sure to choose the commit made by our previous successful experiment!
Click Deploy Endpoint.
cnvrg takes your project (dependencies, code) and wraps it with a thin and scalable REST API. It will import your specified function from the specified file, expose a URL and monitor its activity. Now, the secured URL can be used by your customer and can be embedded in an application or dashboard.
# Querying the model
Congratulations, your endpoint is live. Let's use it. Your endpoint can be added to applications or reached directly from any machine (of course you need the password/token, so it is entirely secure).
For this example we'll demonstrate reaching the live endpoint directly from your terminal and sending in our very own review for classification.
On your now live endpoint's page, towards the bottom you'll see pre-generated code for accessing the endpoint. We've automatically generated the code for both terminal access and embedding in Python programs.

In this case, make sure you click the Curl tab. Then click Copy to Clipboard.
Now open your favorite command-line interface on your machine and paste the code directly in your terminal.
Great. Let's put our own review in. Replace "your_input_params" with a movie review of your own devising. For example, your review might be: "This movie is terrible and a massive waste of time. I absolutely regret going to see it." You can put in any review you want!
Press Enter. Your review will be sent to your endpoint, where predict.py will accept your review as argument for the function predict, run it through your model, and return a sentiment prediction.
The endpoint will give us back a number between 0 and 1, where a number closer to 0 is a more negative review and one closer to 1 is a more positive review (at least according to the model we trained). In my case, I got {"prediction":"0.13214333"}, but you may have received something slightly different depending on which model you deployed.
It's really that easy. You can integrate this endpoint into any application or process you want and cnvrg takes the strain of getting it online out of your hands.
You can also use the cnvrg SDK to send predictions to the endpoints:
Using single prediction
from cnvrg import Endpoint
e = Endpoint("endpoint_id")
e.predict("my_predict")
Using for batch predict
from cnvrg import Endpoint
e = Endpoint("endpoint_id")
e.batch_predict(["my_predict1", "my_predict2",...,"my_predictn"], pool_size=100)
# Monitoring models
Beyond deploying the model into production, cnvrg also provides powerful tools that allow you to monitor the status of your endpoint.
Let's have a look at our endpoint using these tools.
TIP
You'll see more useful information if you have used your model a few times. Maybe run a few more predictions before continuing.
# Charts
The first thing you will see on your endpoints page in the Charts tab is a live overview of all traffic into the endpoint. This is a great way to quickly see the usage of your endpoint.
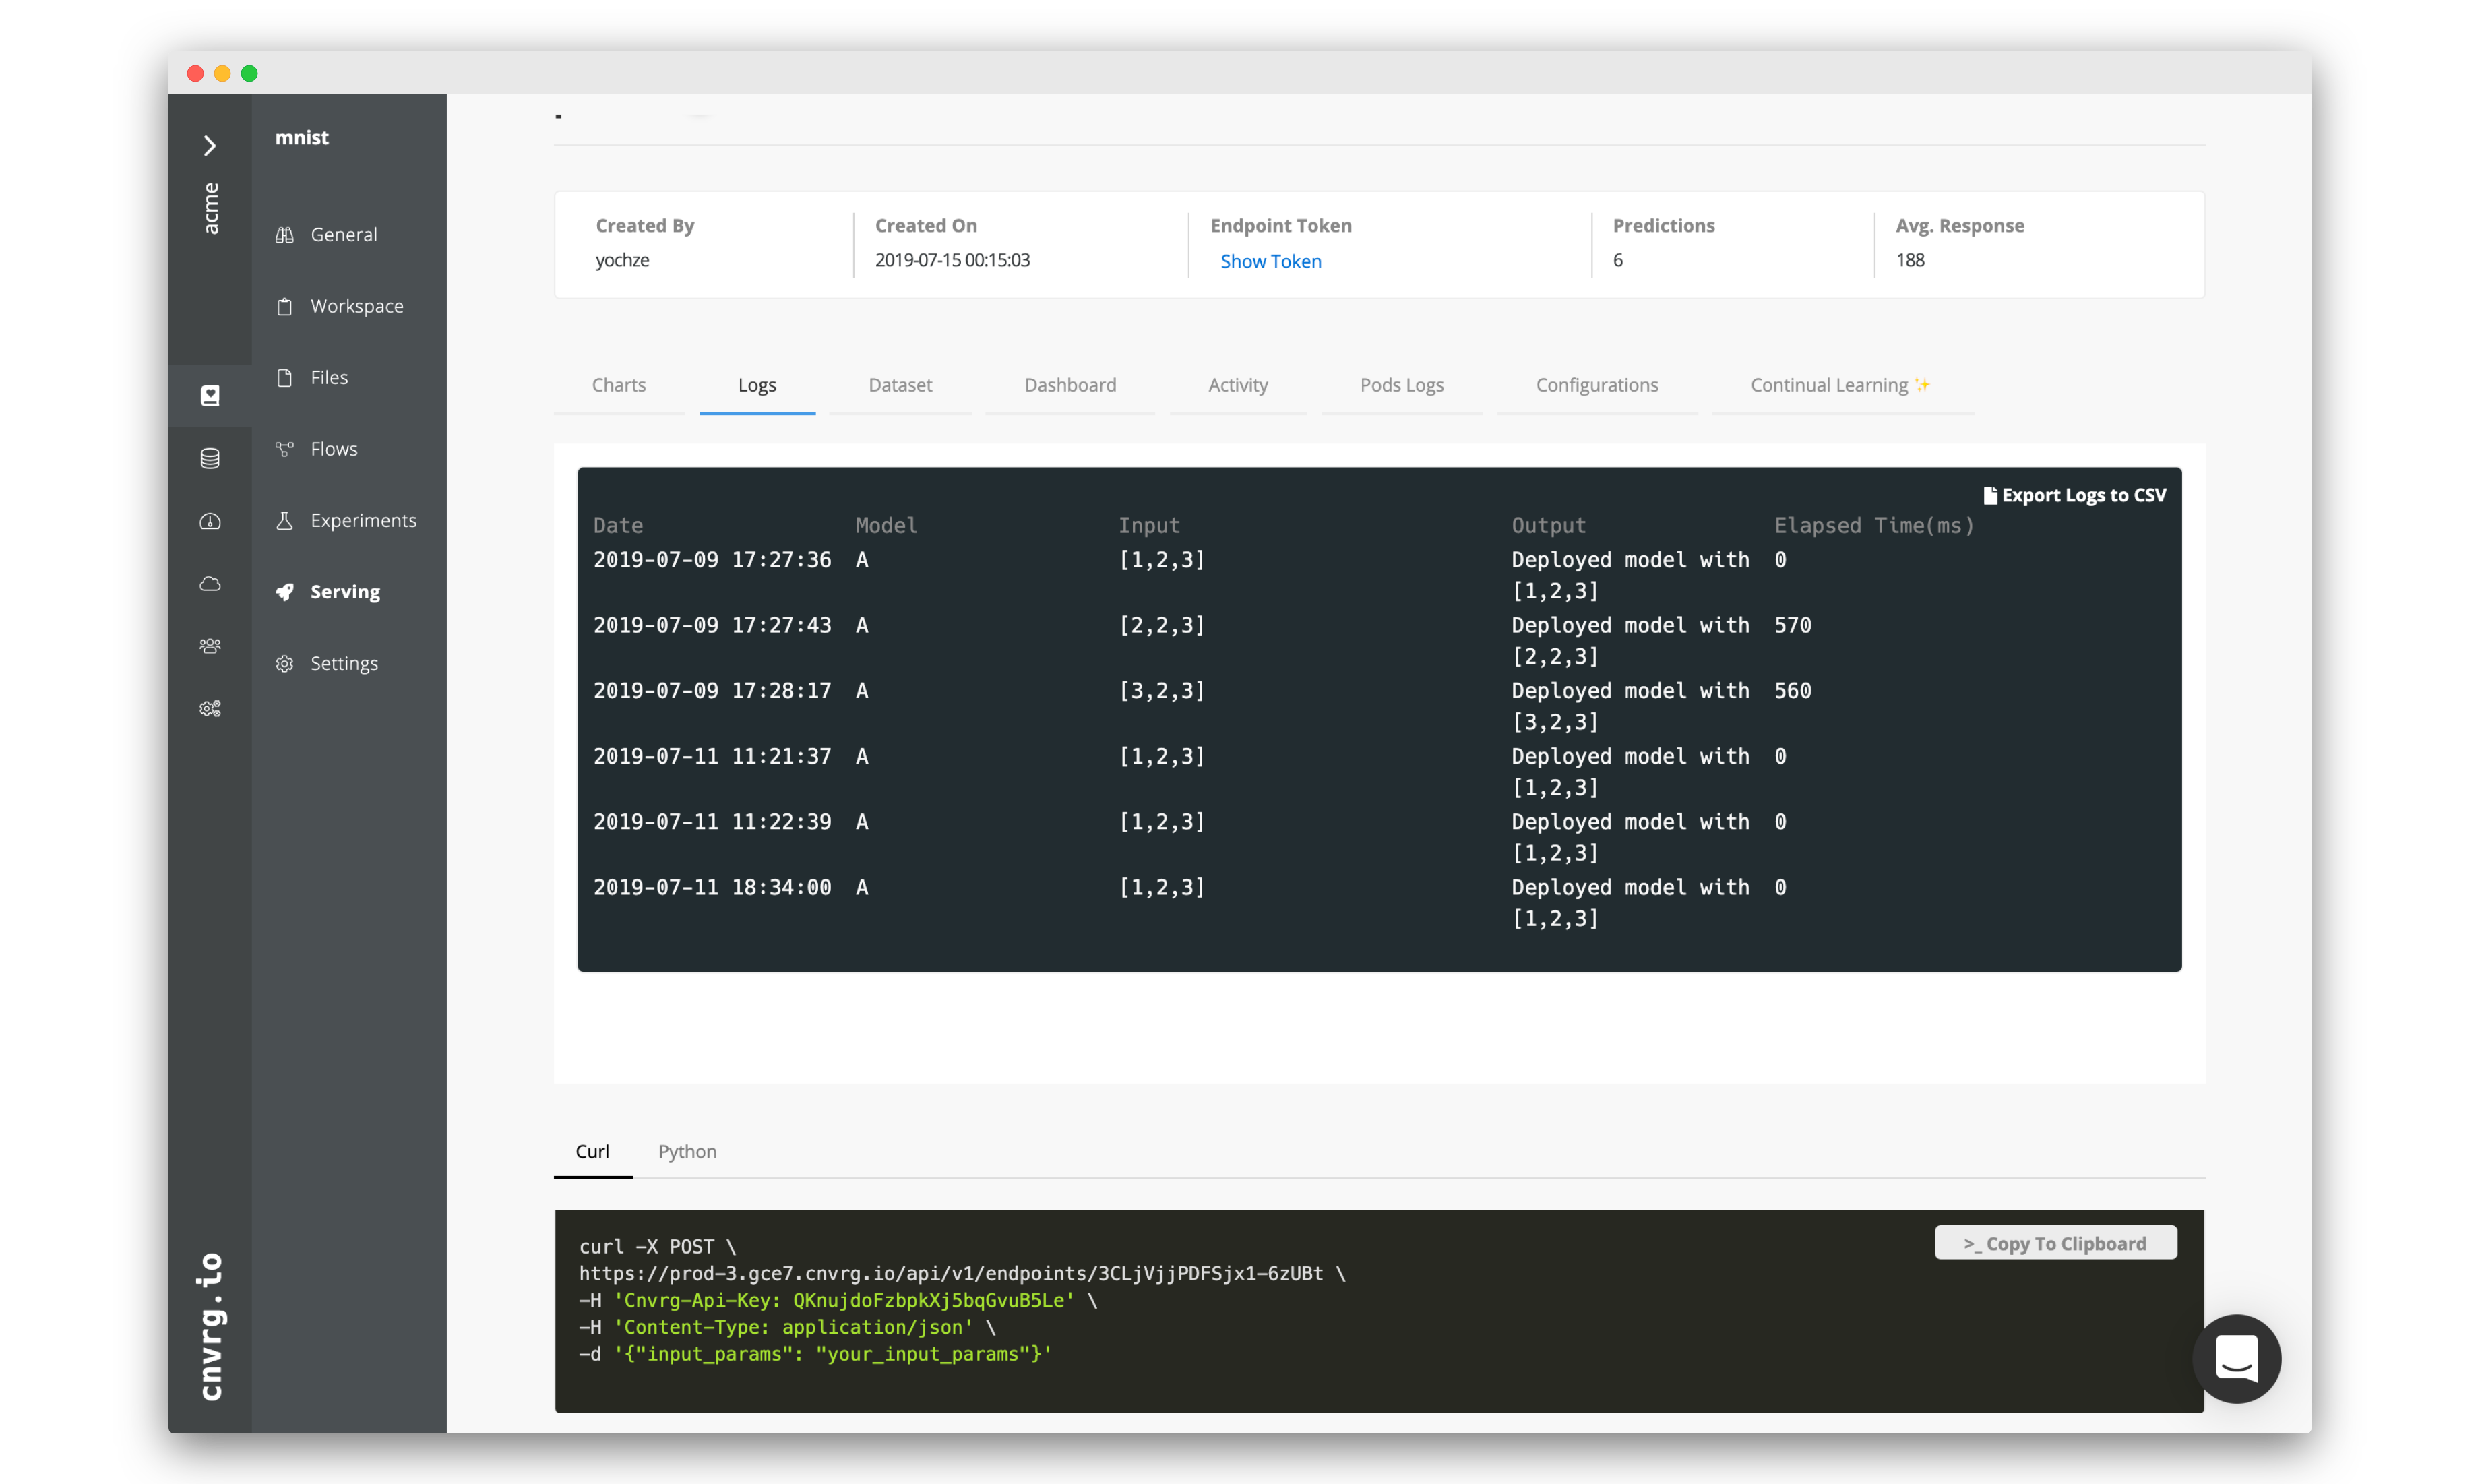
# Logs
You can also switch over to Logs and see exactly what inputs are being sent and what was output by your endpoint.
# Grafana
cnvrg has native integration with Grafana which is a really handy tool for monitoring your compute's resources. Click over to the Grafana tab. Now you'll see a few metrics about the load of your pods. If you select Pods on the top left you will be able to navigate through your Nodes and see deep metrics about the status of your compute.
# Kibana
If you'd like to see all the granular logs for the pods in your endpoint, click over to Pods Logs and you will be presented with an integrated Kibana dashboard featuring incredible depth of information about the activities of your compute.
# Updating models
cnvrg understands that machine learning is an iterative process. A model must be continually refined, retrained on new data and updated to ensure accuracy. To make this as simple as possible, cnvrg supports seamless model updating.
Navigate to the final tab of your endpoint Config. Click New Version in the panel that loads. Under Model 2, you can chose a new commit based on an experiment that produced a more accurate model. Click Update and cnvrg will update the endpoint so that it now leverages the updated model.
This way, your end-users, applications or any code leveraging the endpoint won't see any changes or require any updates and will simply start using the updated model immediately.
TIP
You can use the Validation options in the new model to conduct simple A/B testing to decide which model to ultimately use
# Conclusion
As you can see in this example, cnvrg truly is a full-stack data science solution with all the tools to operate the entire machine learning workflow.
Make sure to check out some of our other tutorials to learn more about cnvrg using different use cases.