# Monitor, Retrain and Learn from your cnvrg Endpoint
cnvrg is built to make production easy. In pursuit of this vision, creating an endpoint in cnvrg is incredibly simple. Any model type can be deployed as an endpoint for batch prediction, live serving through an API or realtime streaming with Kafka.
Additionally, cnvrg has an entire suite of monitoring tools that provide you with everything necessary to ensure your service is working well. In this tutorial, we will work through many of these features that allow you to:
- Create live custom charts
- Set alerts and triggers for retraining and redeploying
- Automatically extract the data from the endpoint for research and training
We will be using the IMDB example project.
# About IMDB
In this example, we’ll be training a text classification model using the IMDB dataset, which is a set of 50,000, highly polarized reviews from the Internet Movie Database.
The model will be a simple binary classification model and if all goes according to plan, should be able to accept a review and tell if it is a ‘positive’ or ‘negative’ review.
Our dataset has already been preprocessed and the written reviews translated into integers, where each integer corresponds with a word in a dictionary.
# Create Live Custom Charts
All endpoints in cnvrg require a Predict function. This function is responsible for querying the model that you provide. Each input to the service will be handed to the function and the output of the function will be the prediction.
You can also optionally include a Preprocess function which will run on every input. In this case the Predict function will run on ach output of the Preprocess function.
Importantly, both these functions are written by you. cnvrg will do all the backend DevOps and MLOps work for you, creating a capable deployment onto Kubernetes, but the Predict and Preprocess functions are written by you and your team.
This setup allows you to run any code as part of your endpoint, including using the Python SDK for tracking metrics in your service. You can track anything you want, accuracy, confidence, null values and so on. cnvrg will then automatically graph these metrics on the Charts tab of the endpoint's page.
Use the log_metric() method to log a metric:
from cnvrg import Endpoint
e = Endpoint("endpoint_id")
e.log_metric('metric_name',value)
Let's step through a real example using the IMDB example project.
# Getting the project started
On the website, navigate to the Projects tab.
Welcome to the home of your code, experiments, flows and deployments. Here everything lives and works together.
For this example, we’ll use the prebuilt example project. On the top right, click Example Projects.
Select Text Classification with Keras and IMDB dataset.
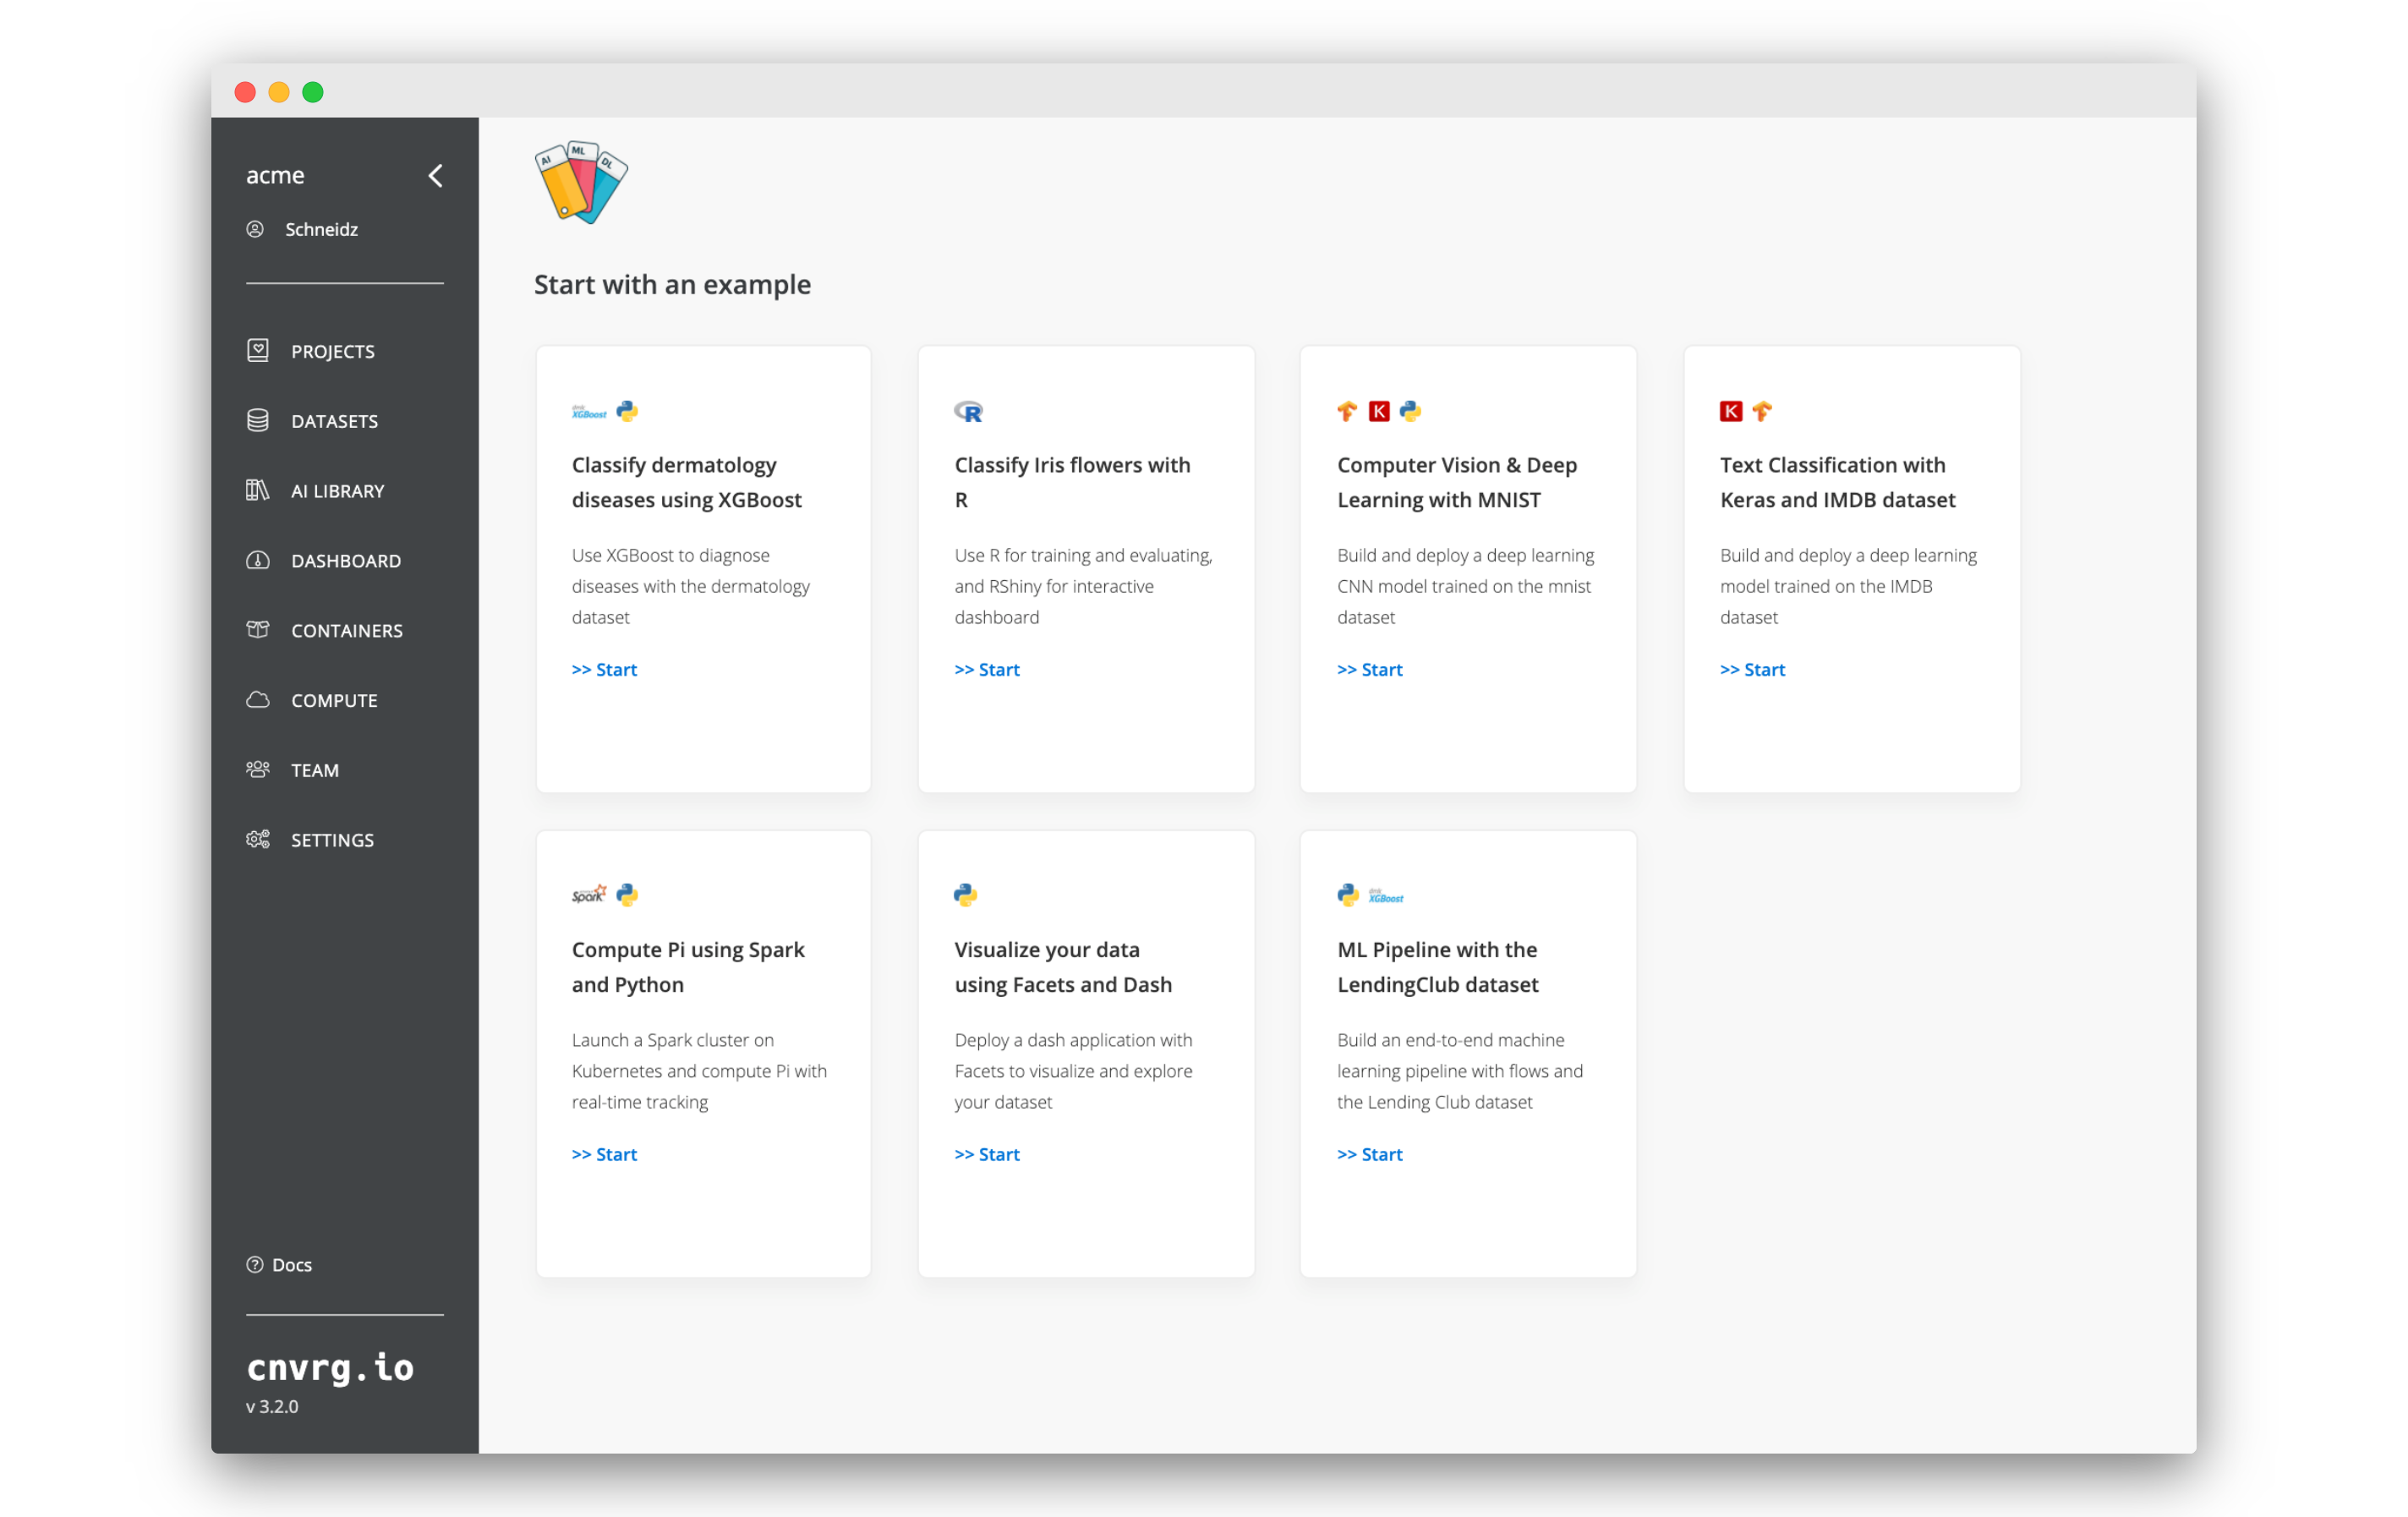
Now you’ve created a cnvrg project titled imdb. The imdb project dashboard is displayed.
# Edit predict.py
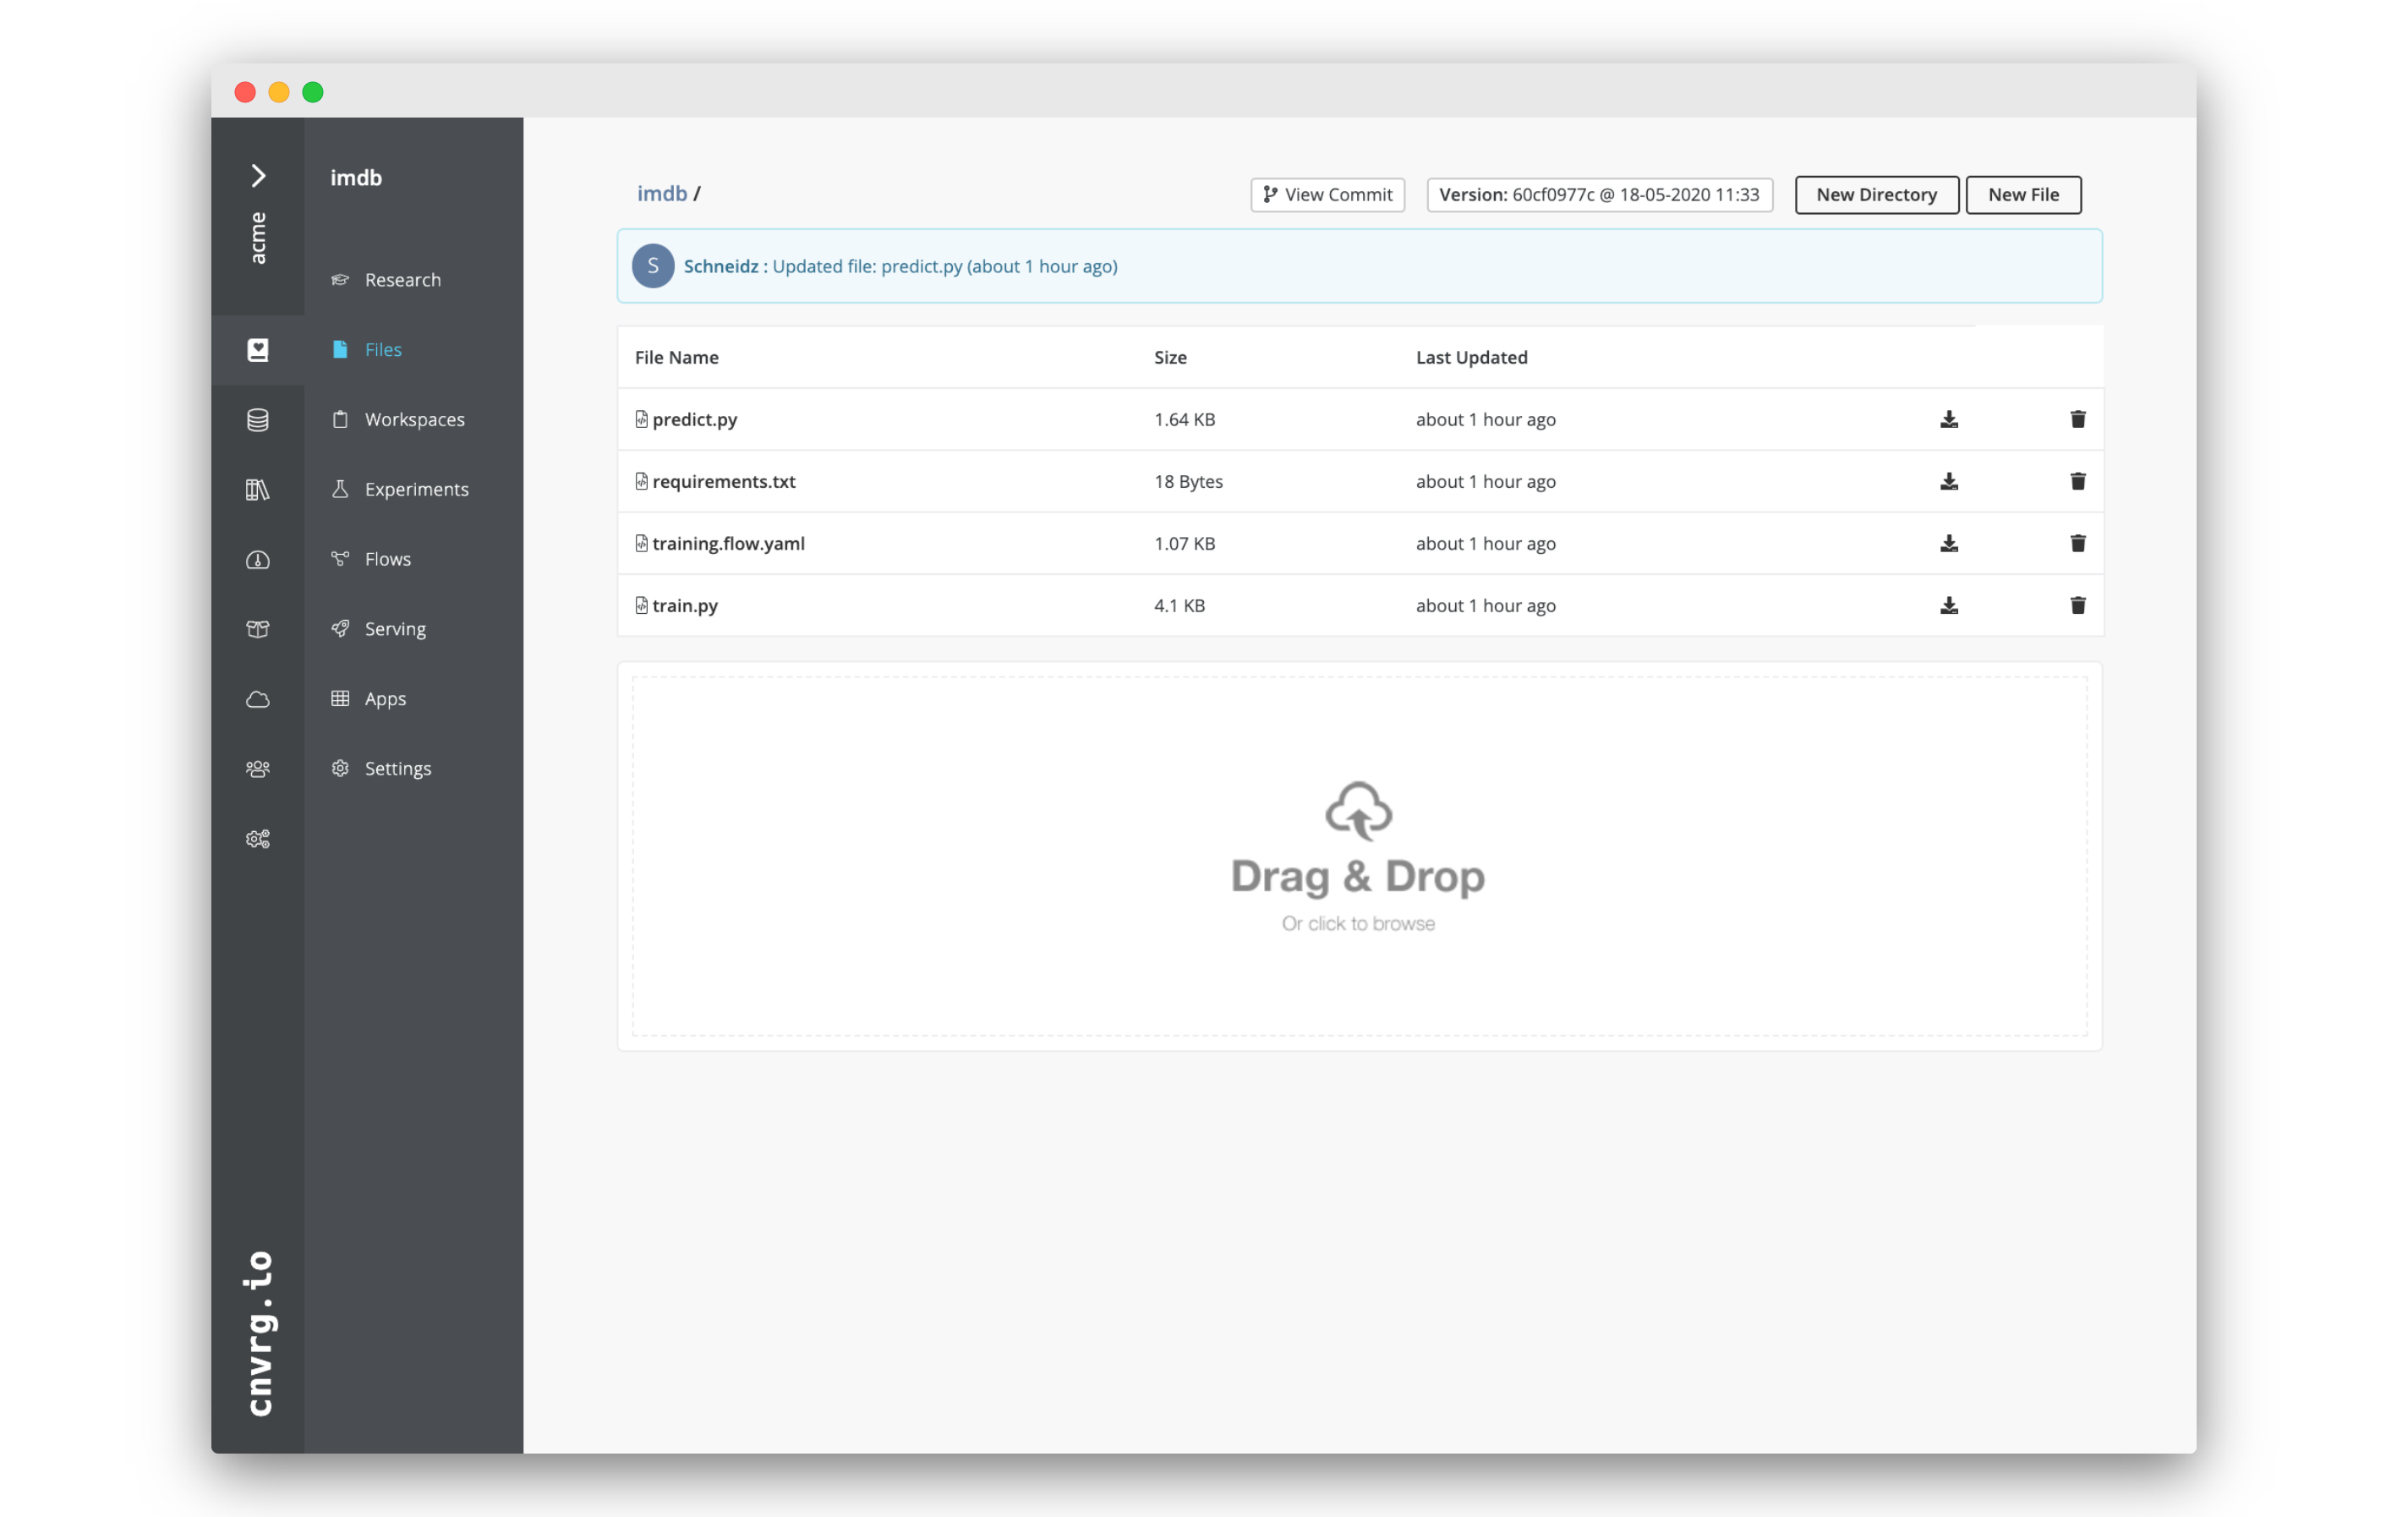
We will now edit the predict.py file to add some tracking capabilities.
Go to the Files tab of the IMDB project you just created.
Click on
predict.py.Click Edit.
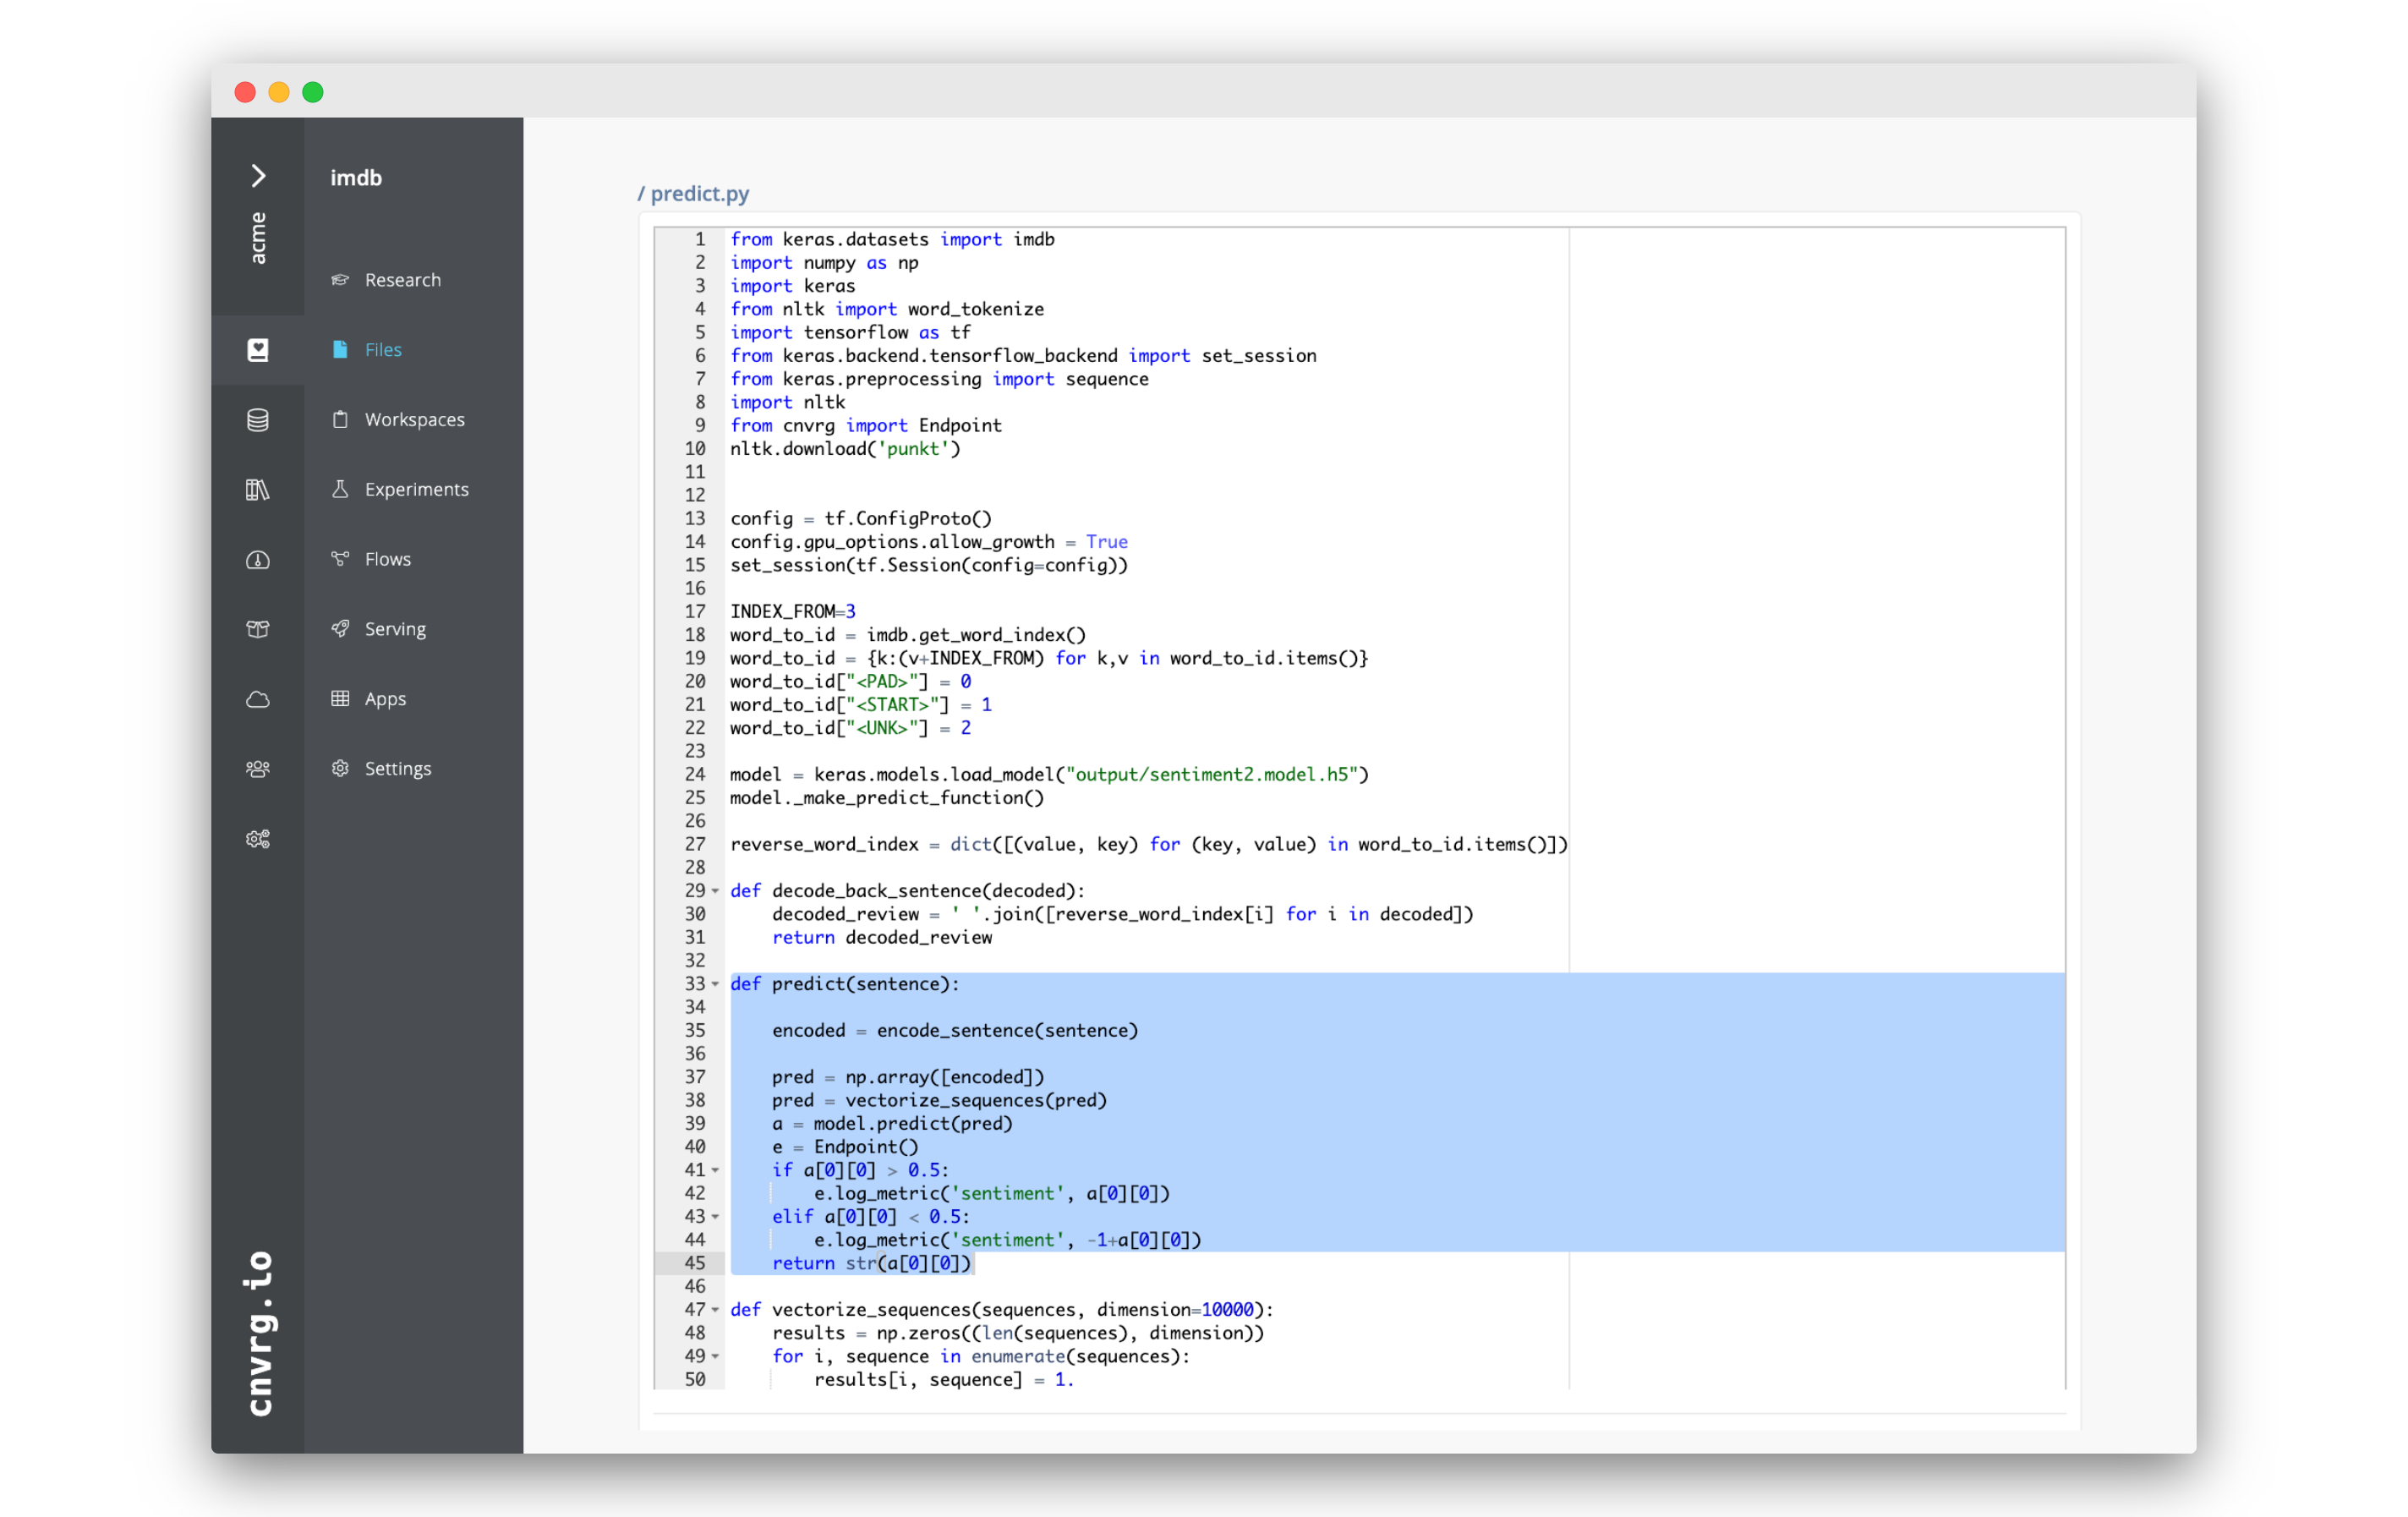
Between lines
39and40, add the following code:e = Endpoint() if a[0][0] > 0.5: e.log_metric('sentiment', a[0][0]) elif a[0][0] < 0.5: e.log_metric('sentiment', -1+a[0][0]))The full predict function should look like:
def predict(sentence):

    encoded = encode_sentence(sentence)

    pred = np.array([encoded])
    pred = vectorize_sequences(pred)
    a = model.predict(pred)
    e = Endpoint()
    if a[0][0] > 0.5:
        e.log_metric('sentiment', a[0][0])
    elif a[0][0] < 0.5:
        e.log_metric('sentiment', -1+a[0][0])
    return str(a[0][0])
Click Save to update the file.
What you have done, is add tracking of the overall sentiment of the reviews that are received as inputs. If the review is positive, the sentiment is added to the total, and if the review is negative, it is subtracted. That way, if all the reviews were for a single movie, you could easily get at a glance insight into the overall reception of the movie.
# Train and deploy a model
 When you created the IMDB example project, cnvrg automatically created a flow in the project. When run, this flow will conduct a grid search and deploy the champion model into production as an API. We will use the flow to setup our own model.
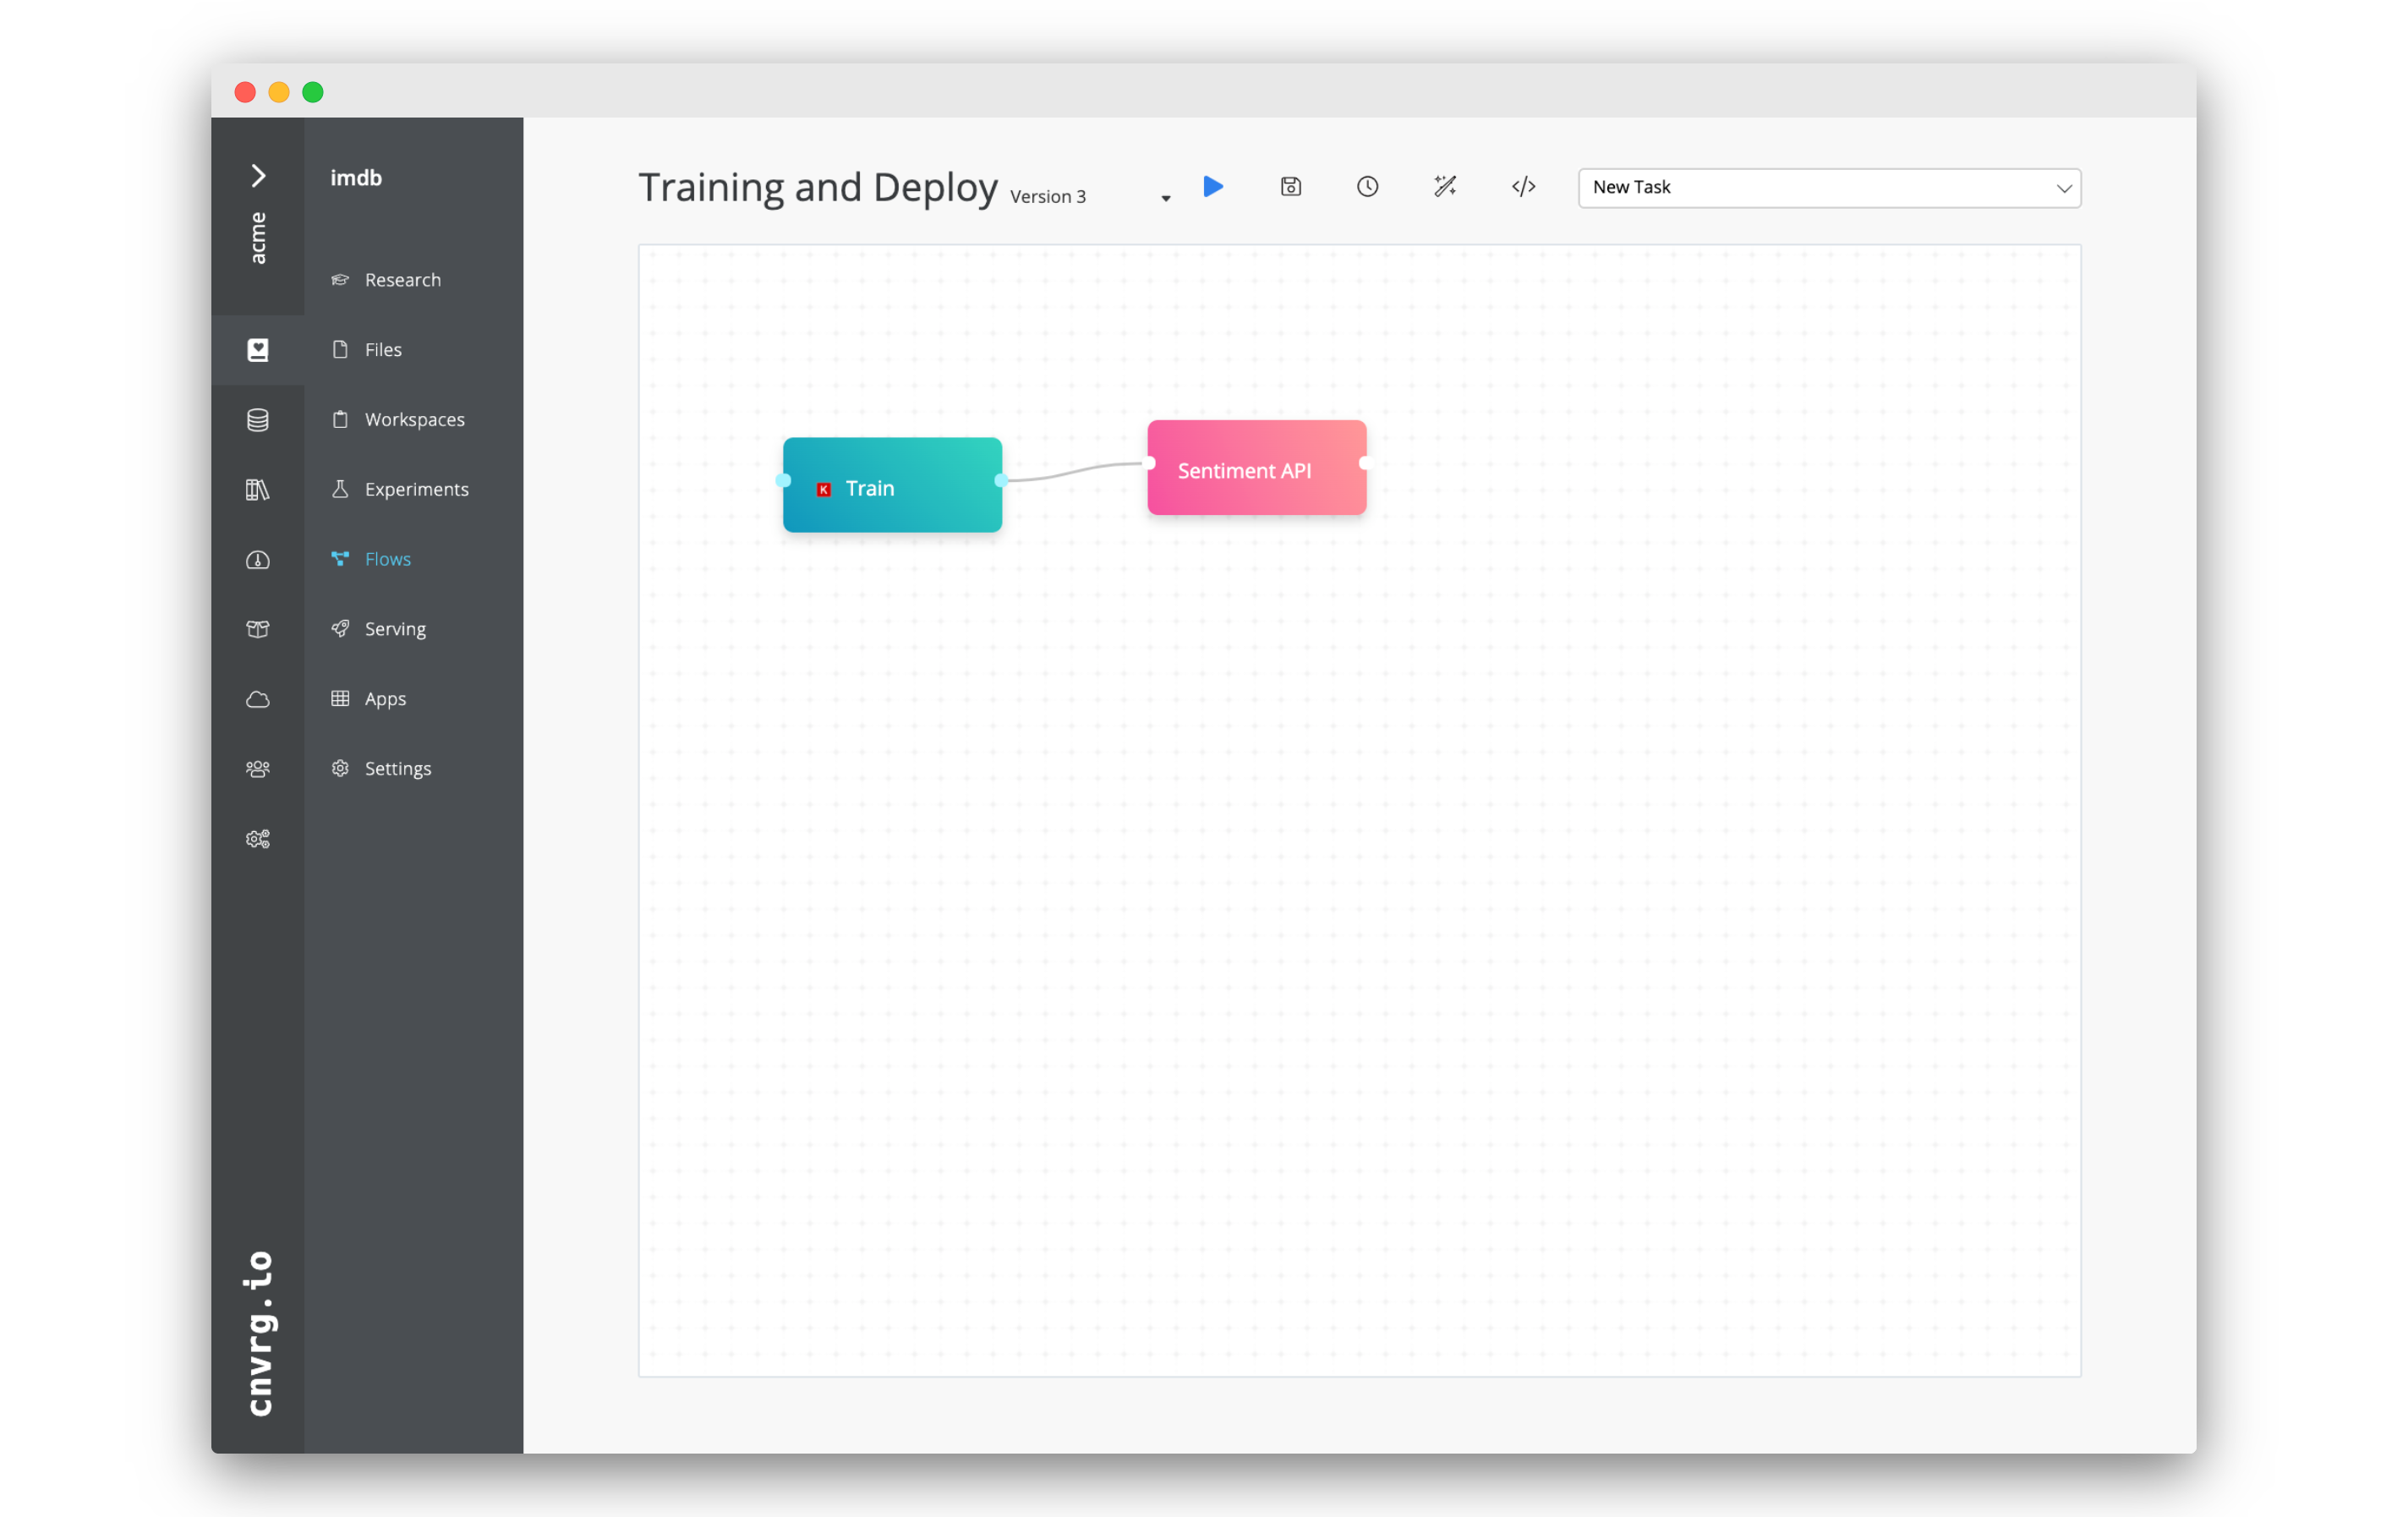
- Go to the Flows tab of the project.
- Click on Training and Deploy
- Feel free to examine the flow. You will notice that in the Deploy task,
predict.pyis set as the file for prediction andpredictis set as the function. - When ready, click Run (the blue play button) to start the flow which will train and deploy a model.
- Click Run on th pop up to confirm.
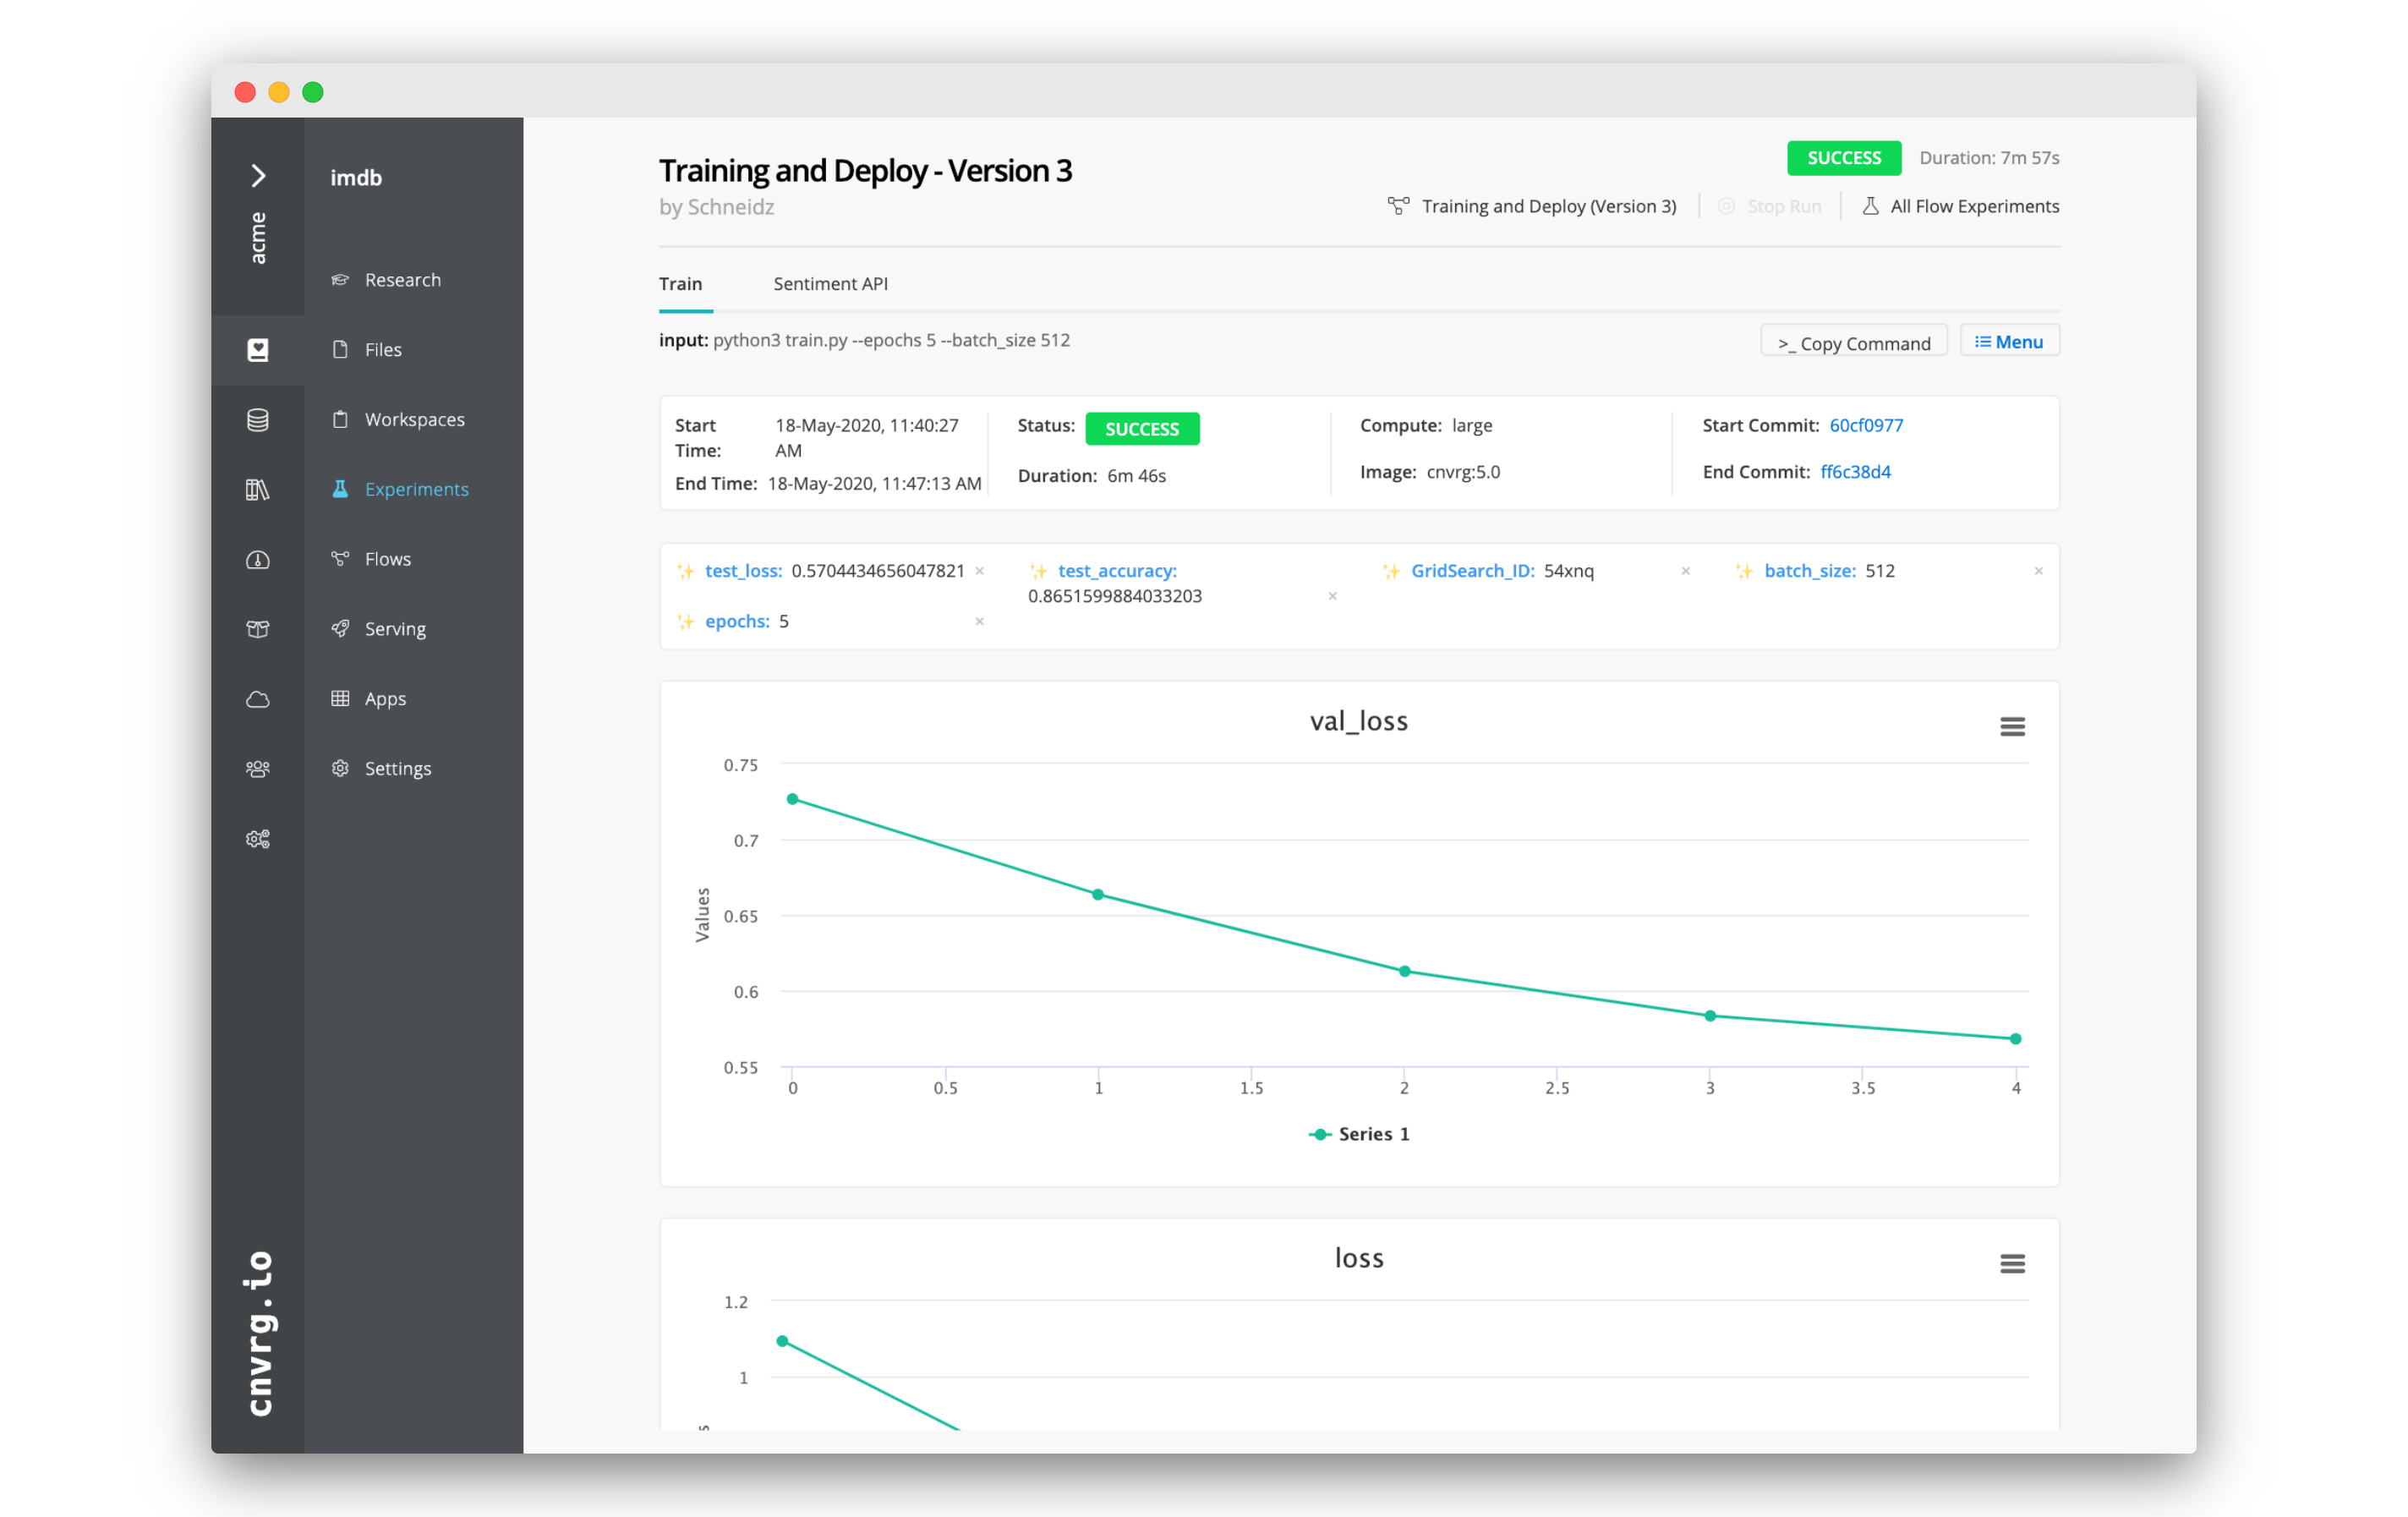
Four experiments will start, and when completed, the most accurate model will be deployed. Follow the progress from the flow run pages in the Experiments tab.
# Query the model
 Now, that the model is up and running, we can query the model.
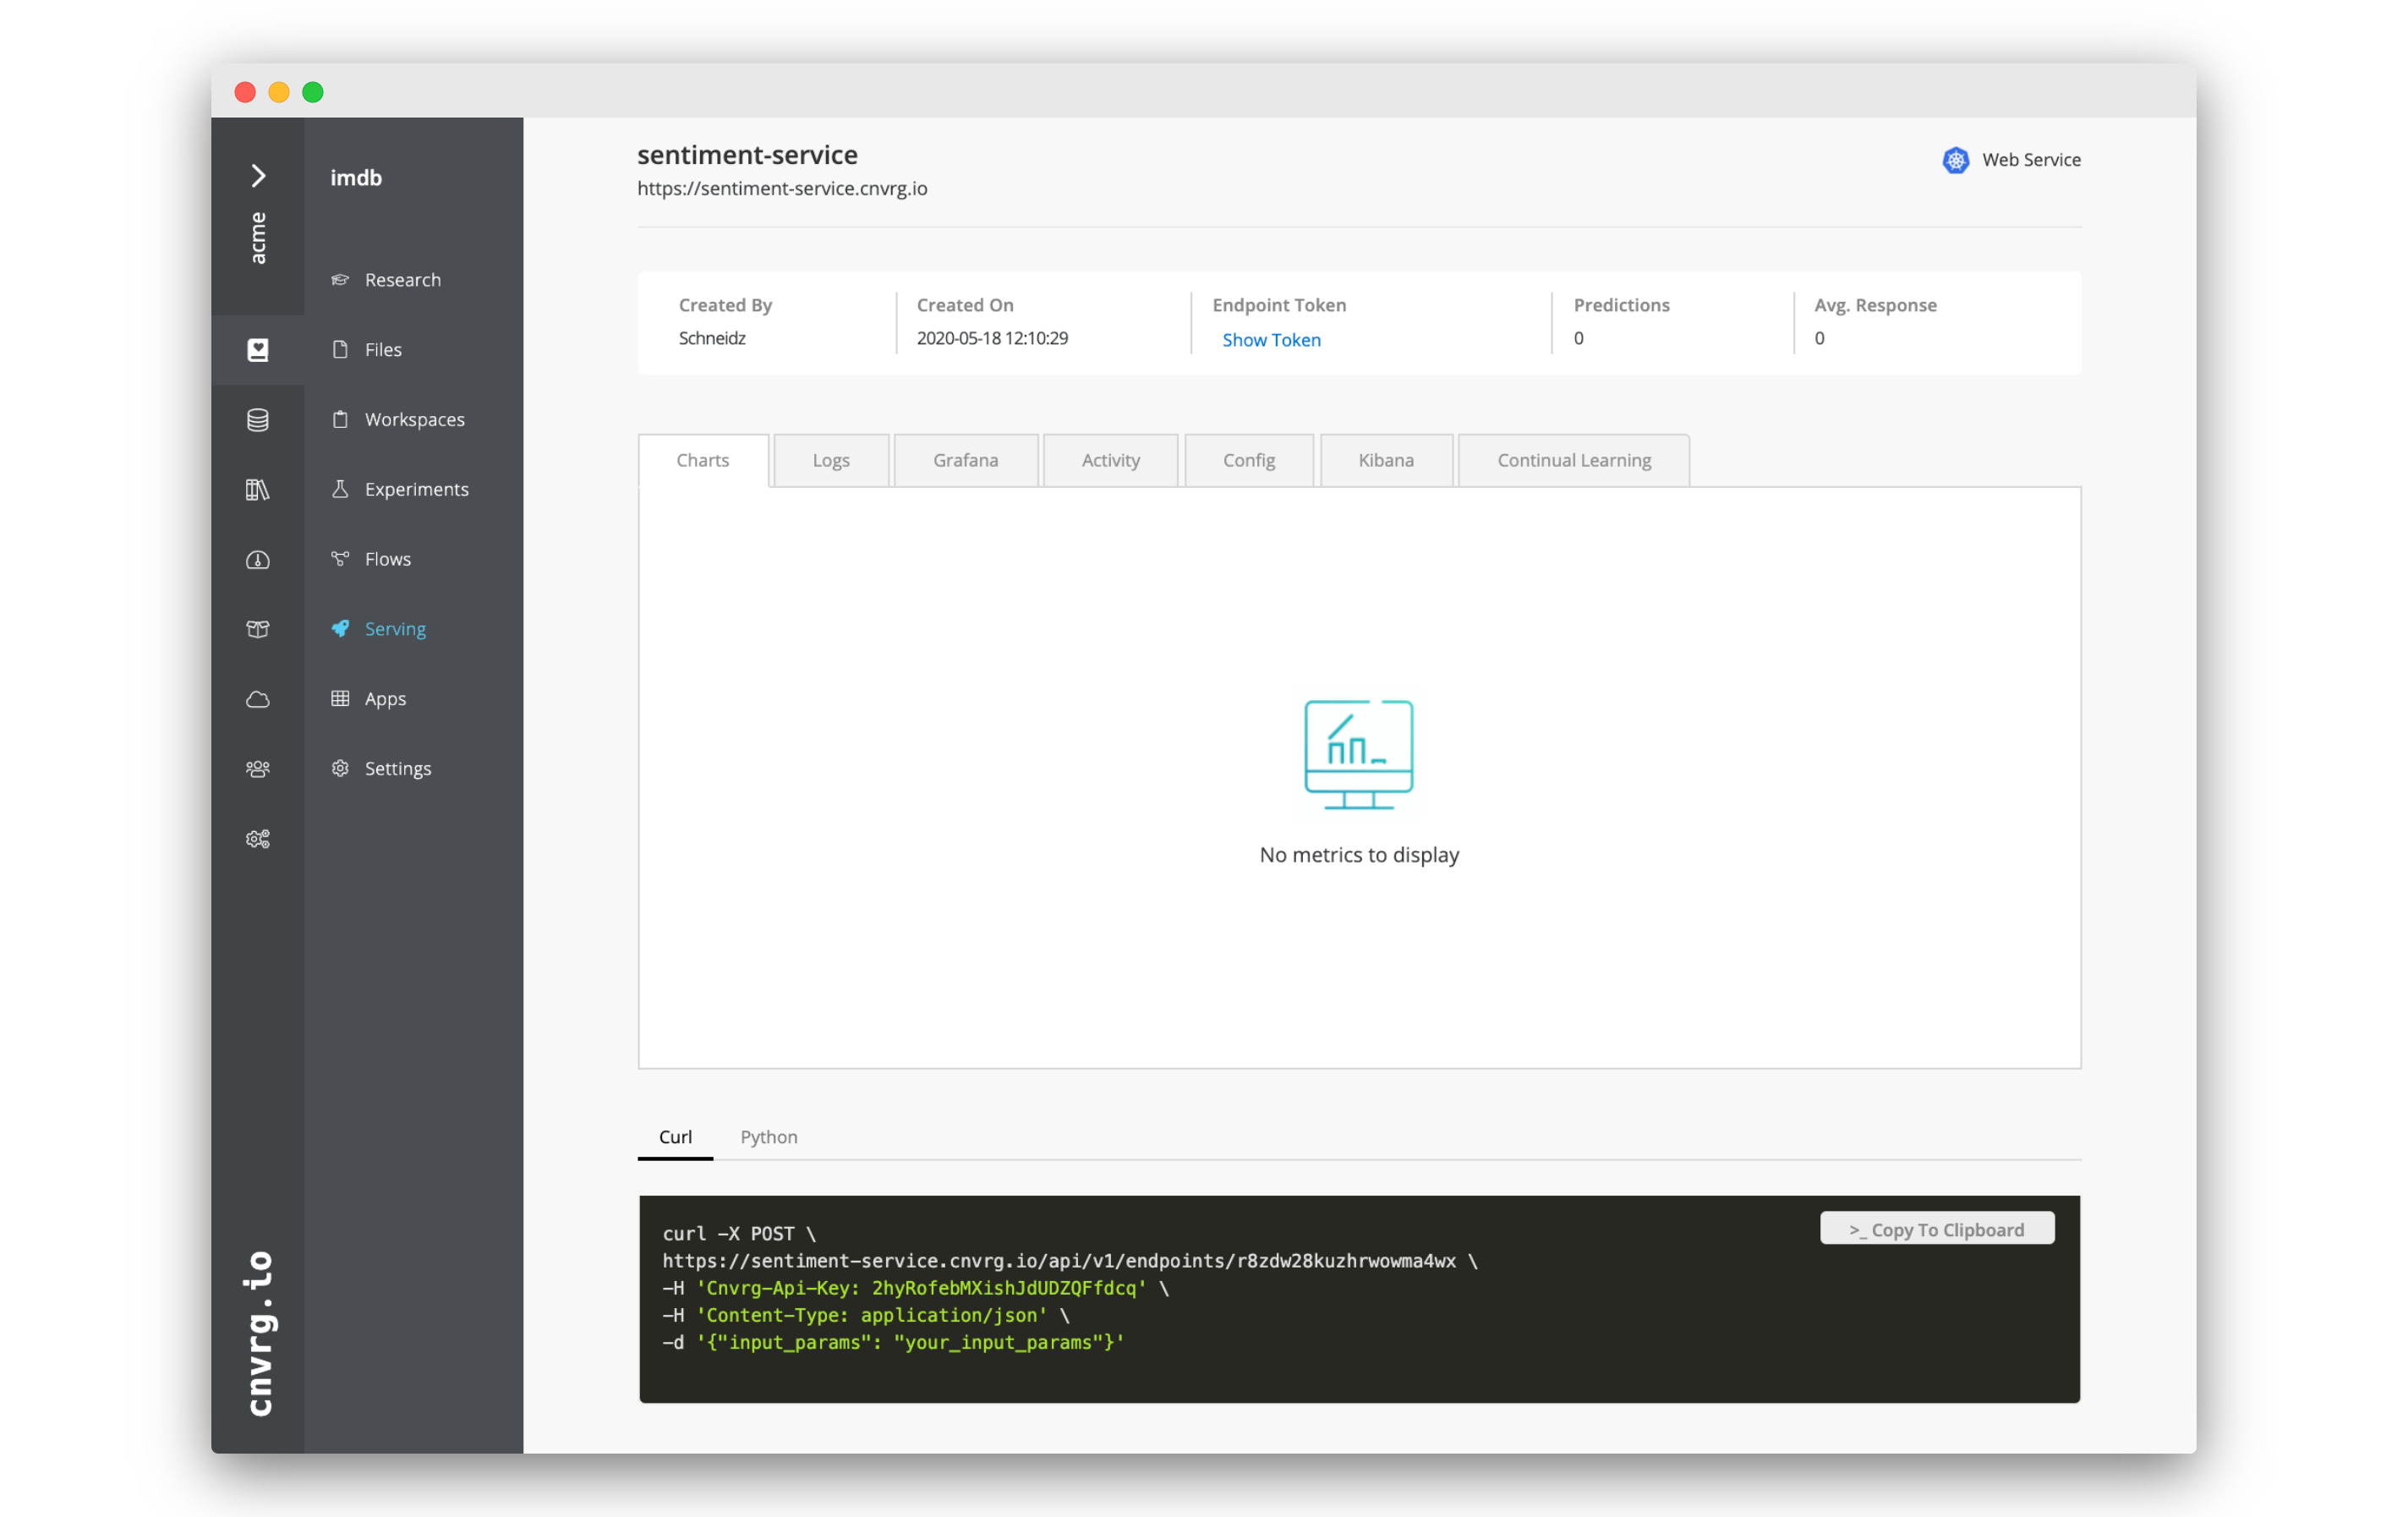
- Go to the Serving tab.
- Click on Sentiment Service. (If it is not there yet, you may need to wait until the flow finishes).
- At the bottom of the page will be a black box with an example
curlsnippet that you can use to query the endpoint. - Either run it in the terminal on your own machine, or open a workspace and query it inside the remote IDE.
You can submit any review/string as an input, simply replace "your_input_params" in the snippet with the review or sentence.
Here are some reviews you can use.
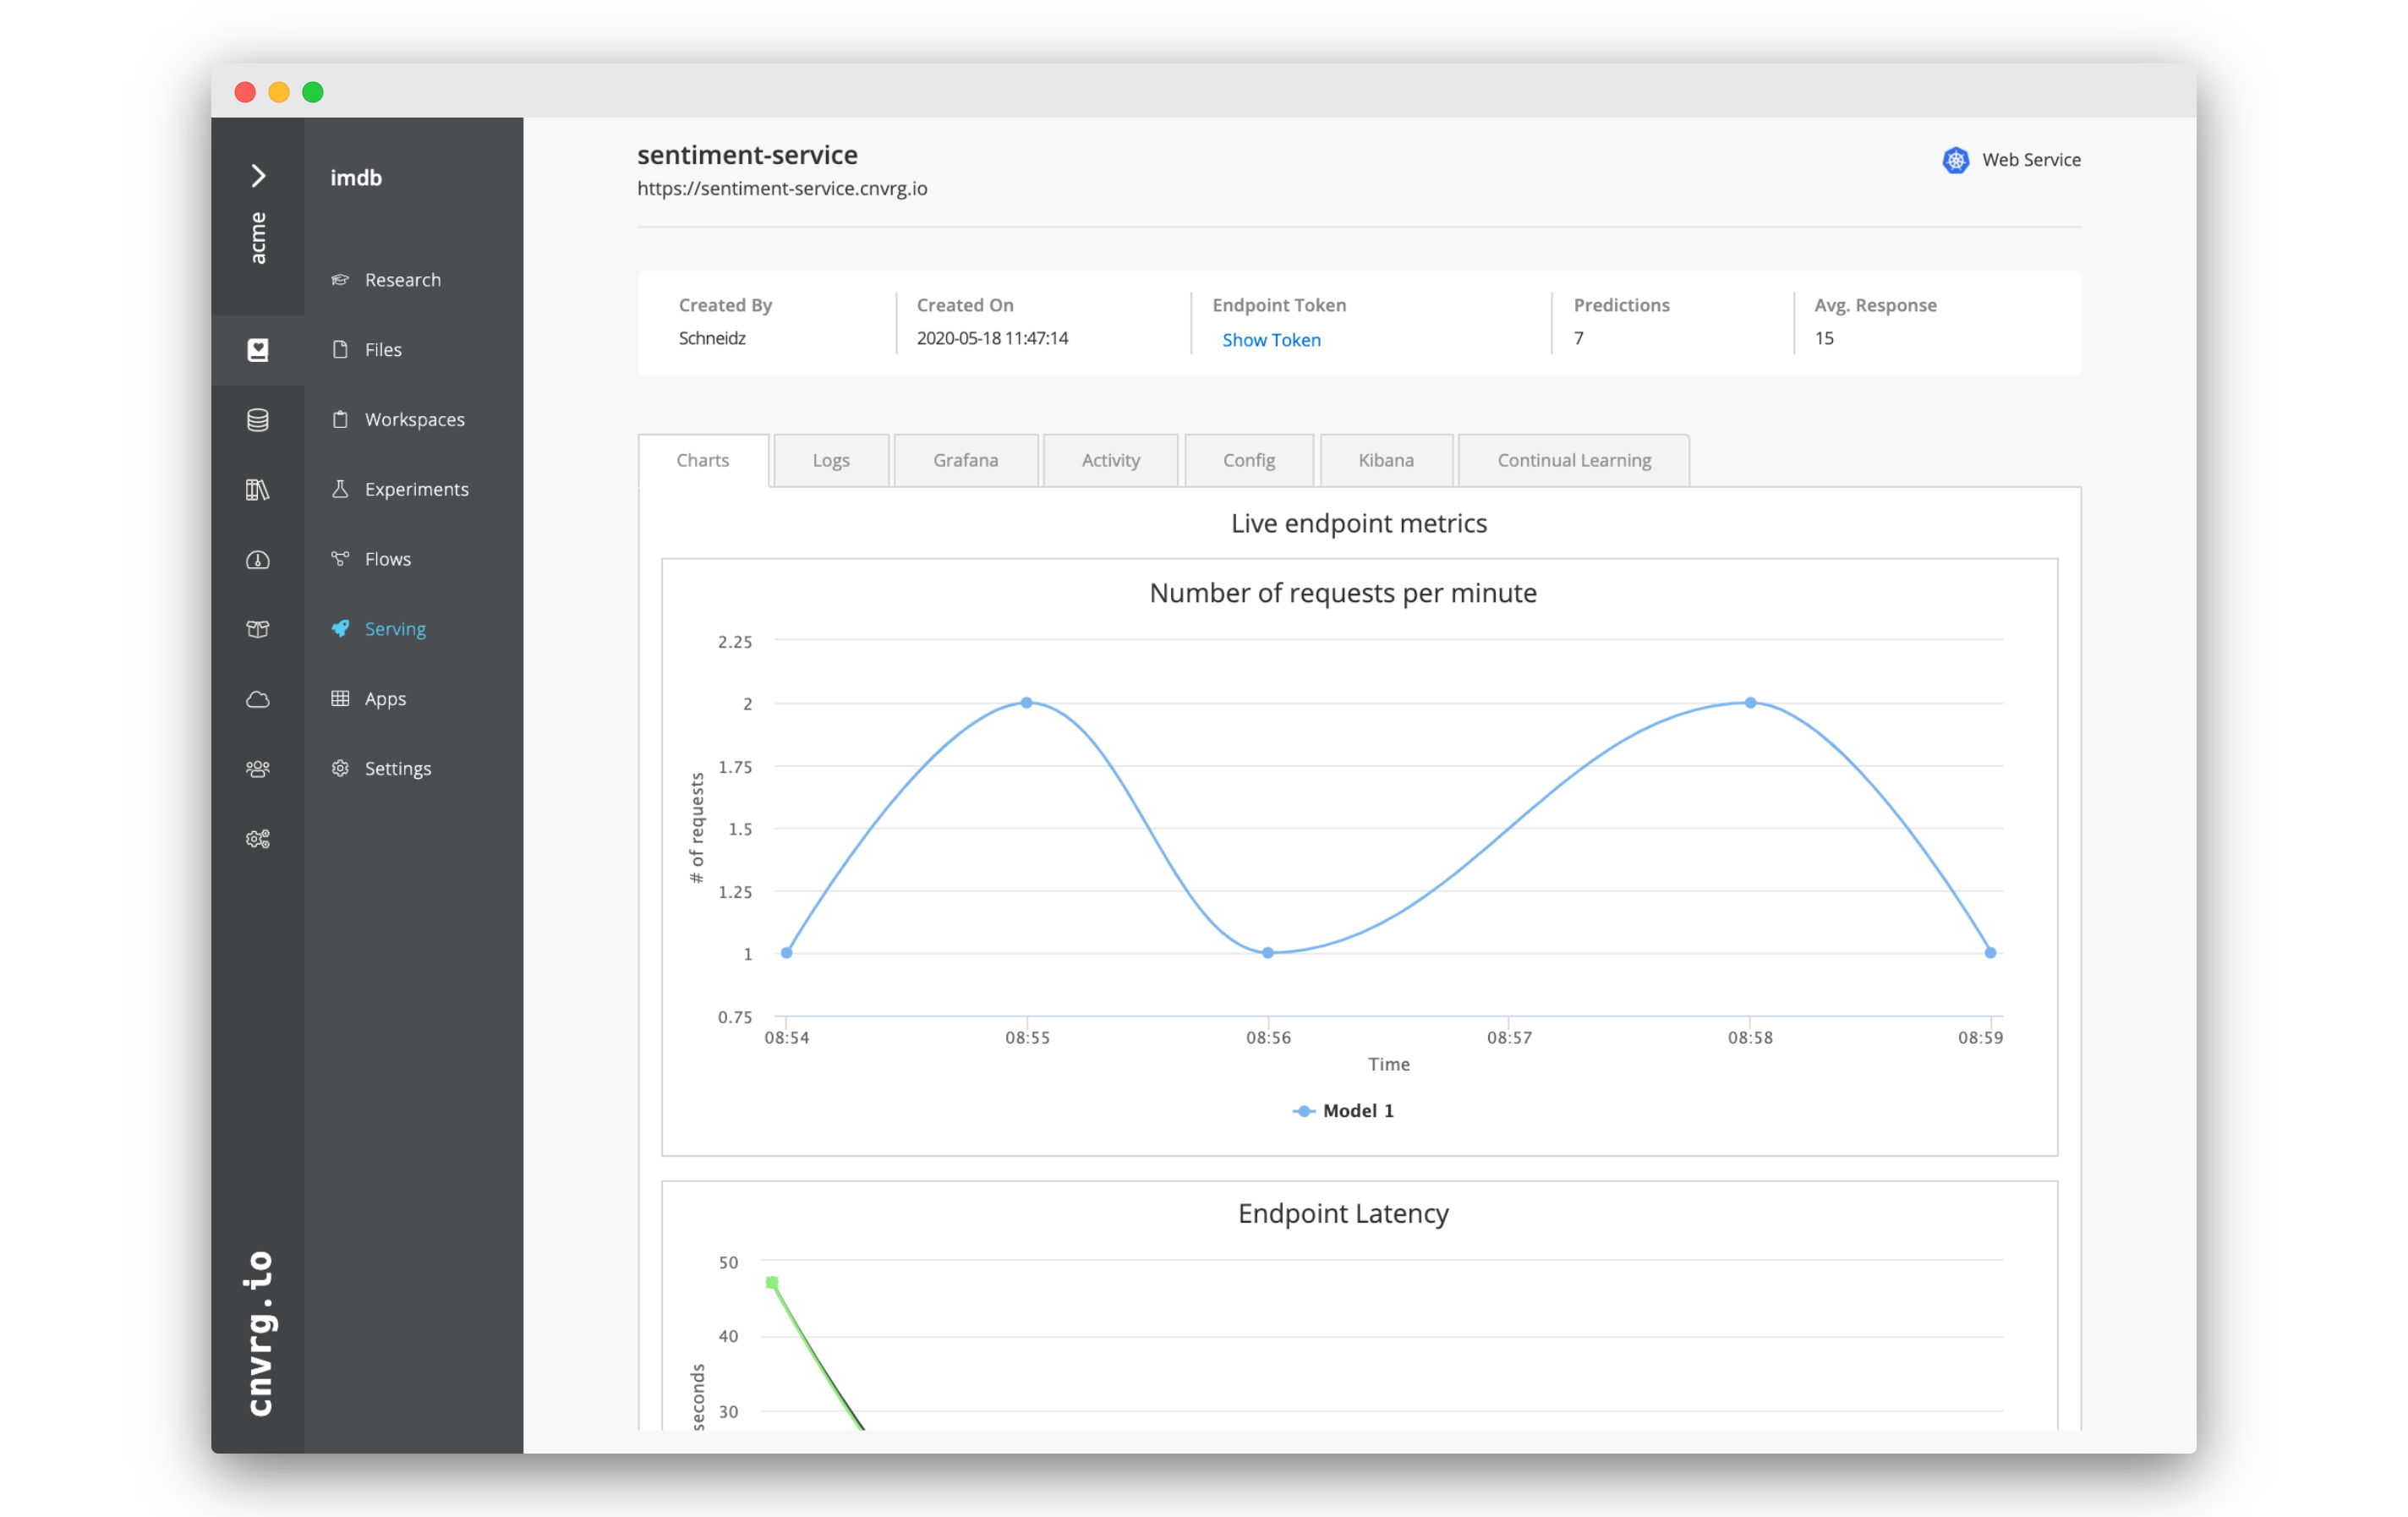
# Checking the charts
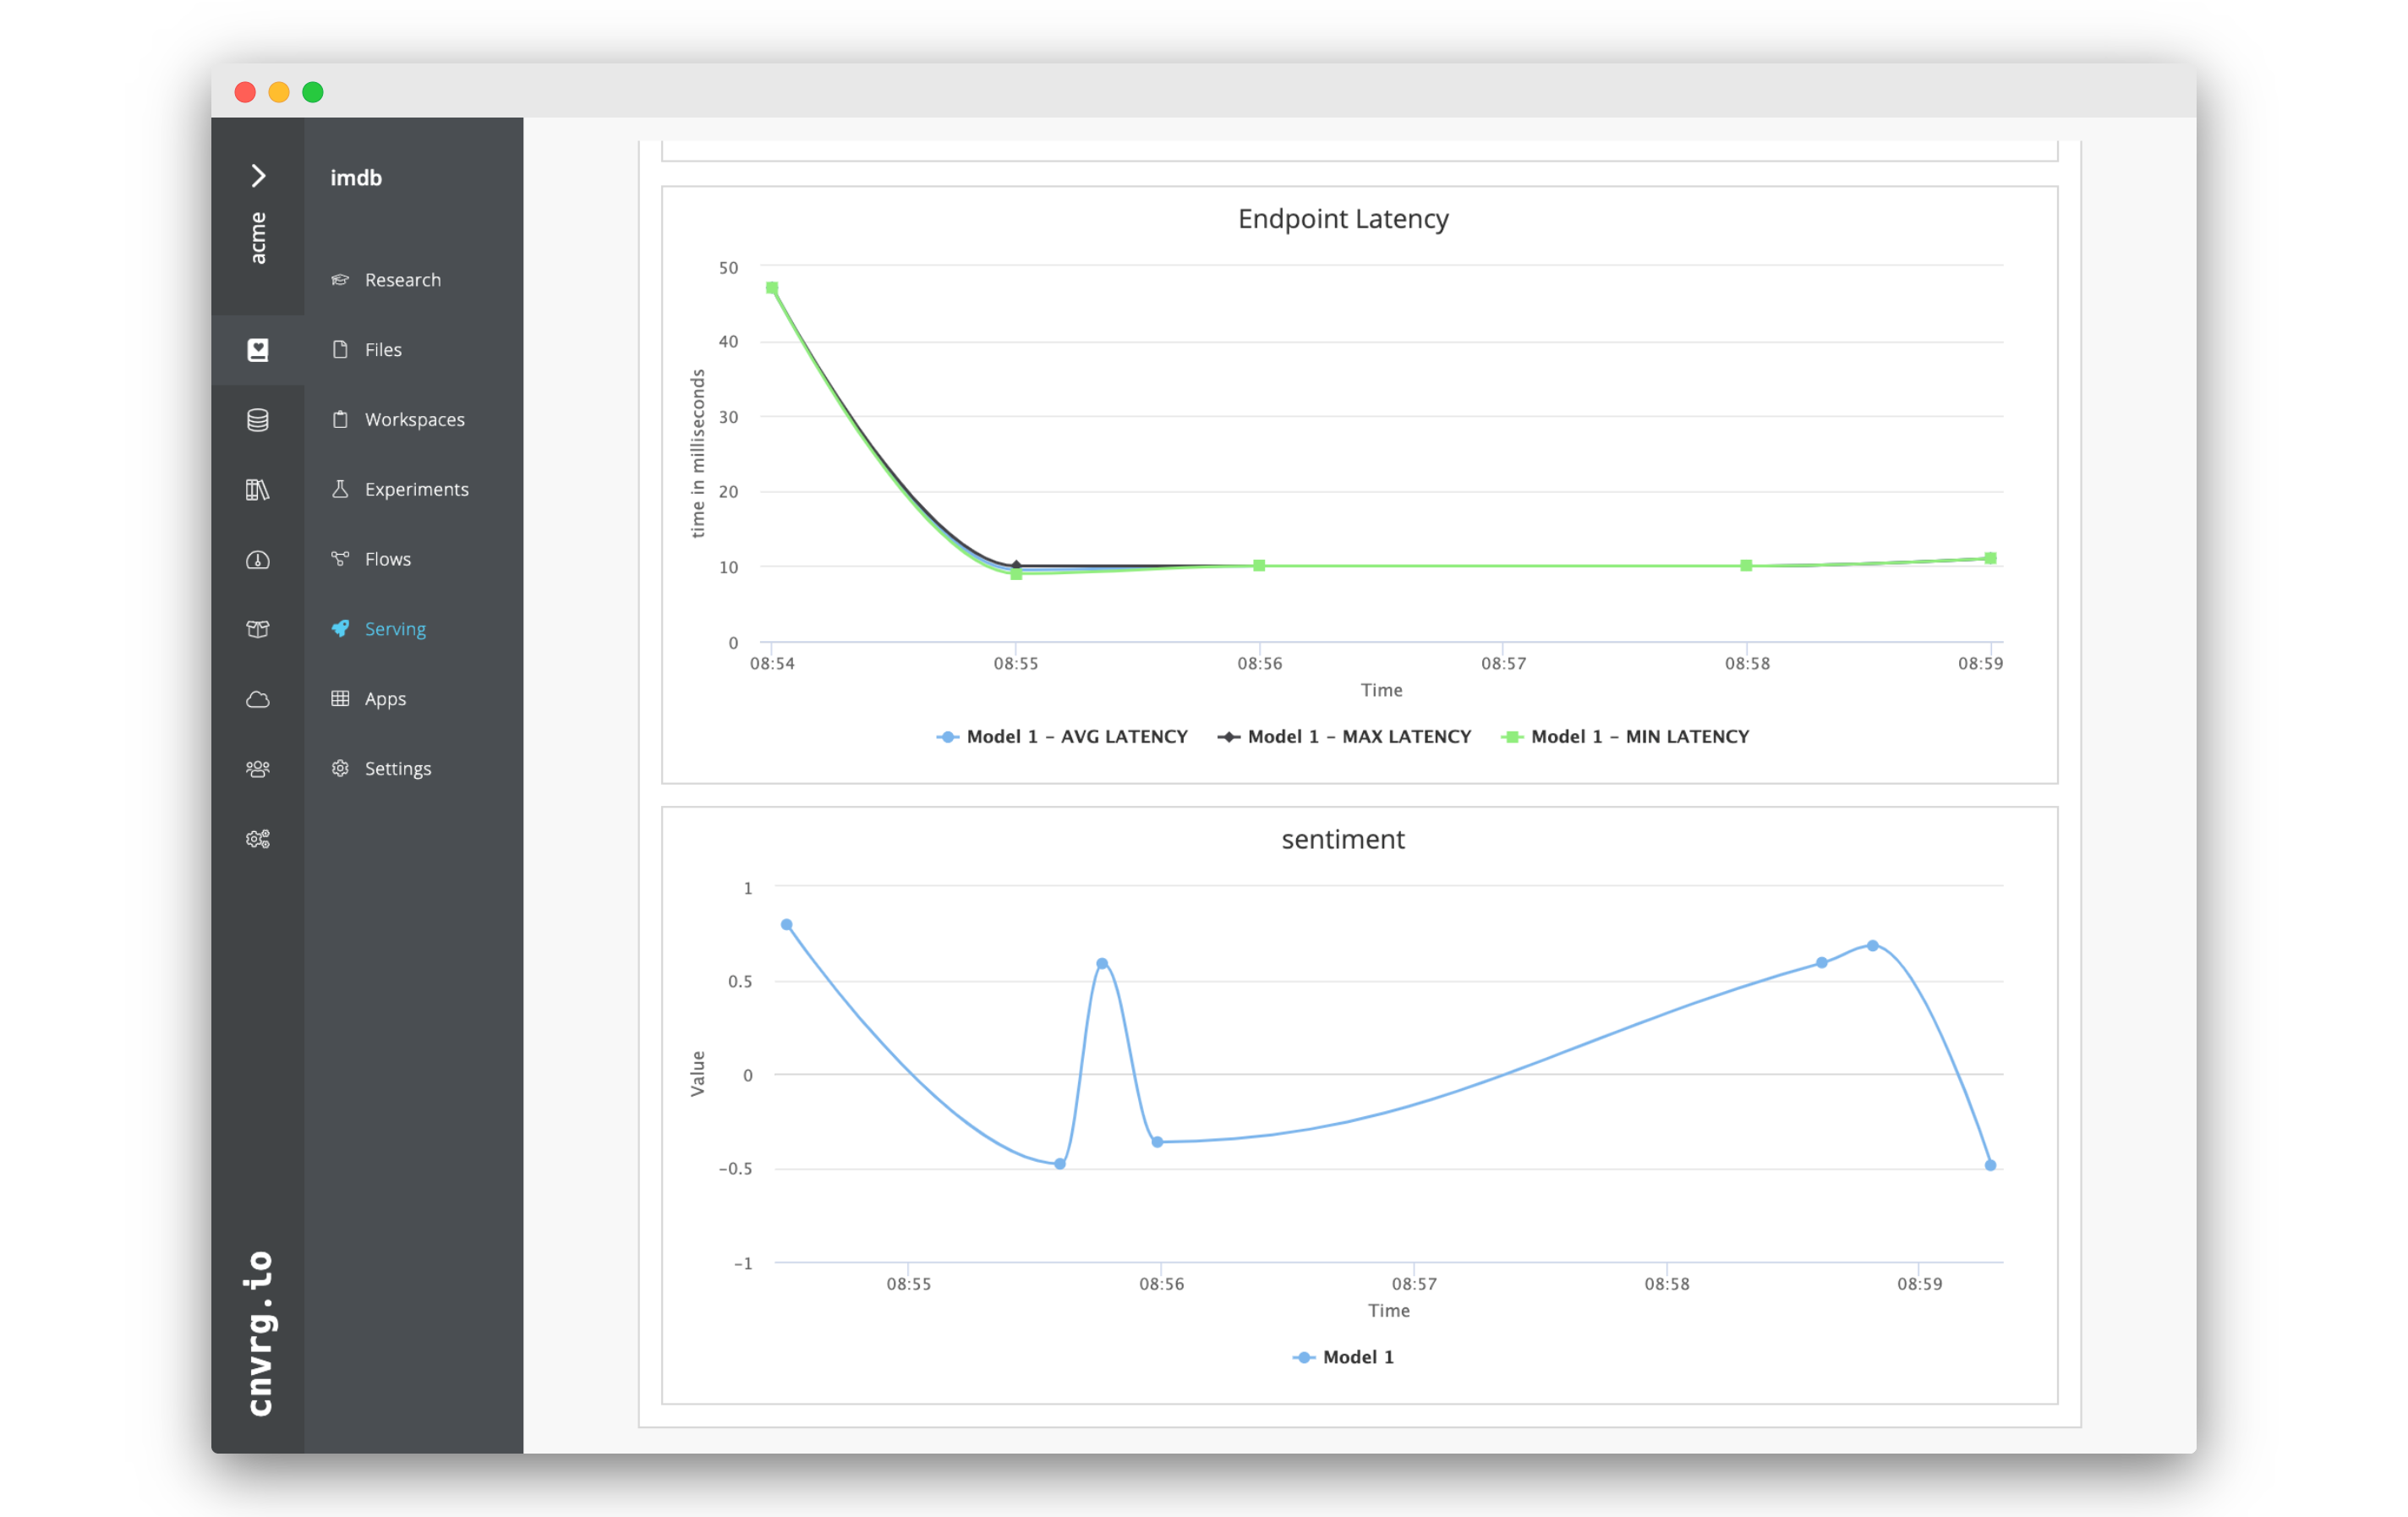 As you query the model, the charts on the Charts tab will automatically update. There the Number of requests per minute, Endpoint Latency an sentiment will be charted. Have a look as they update!
This allows you to easily monitor anything inside your service and keep an eye on the health of your endpoint.
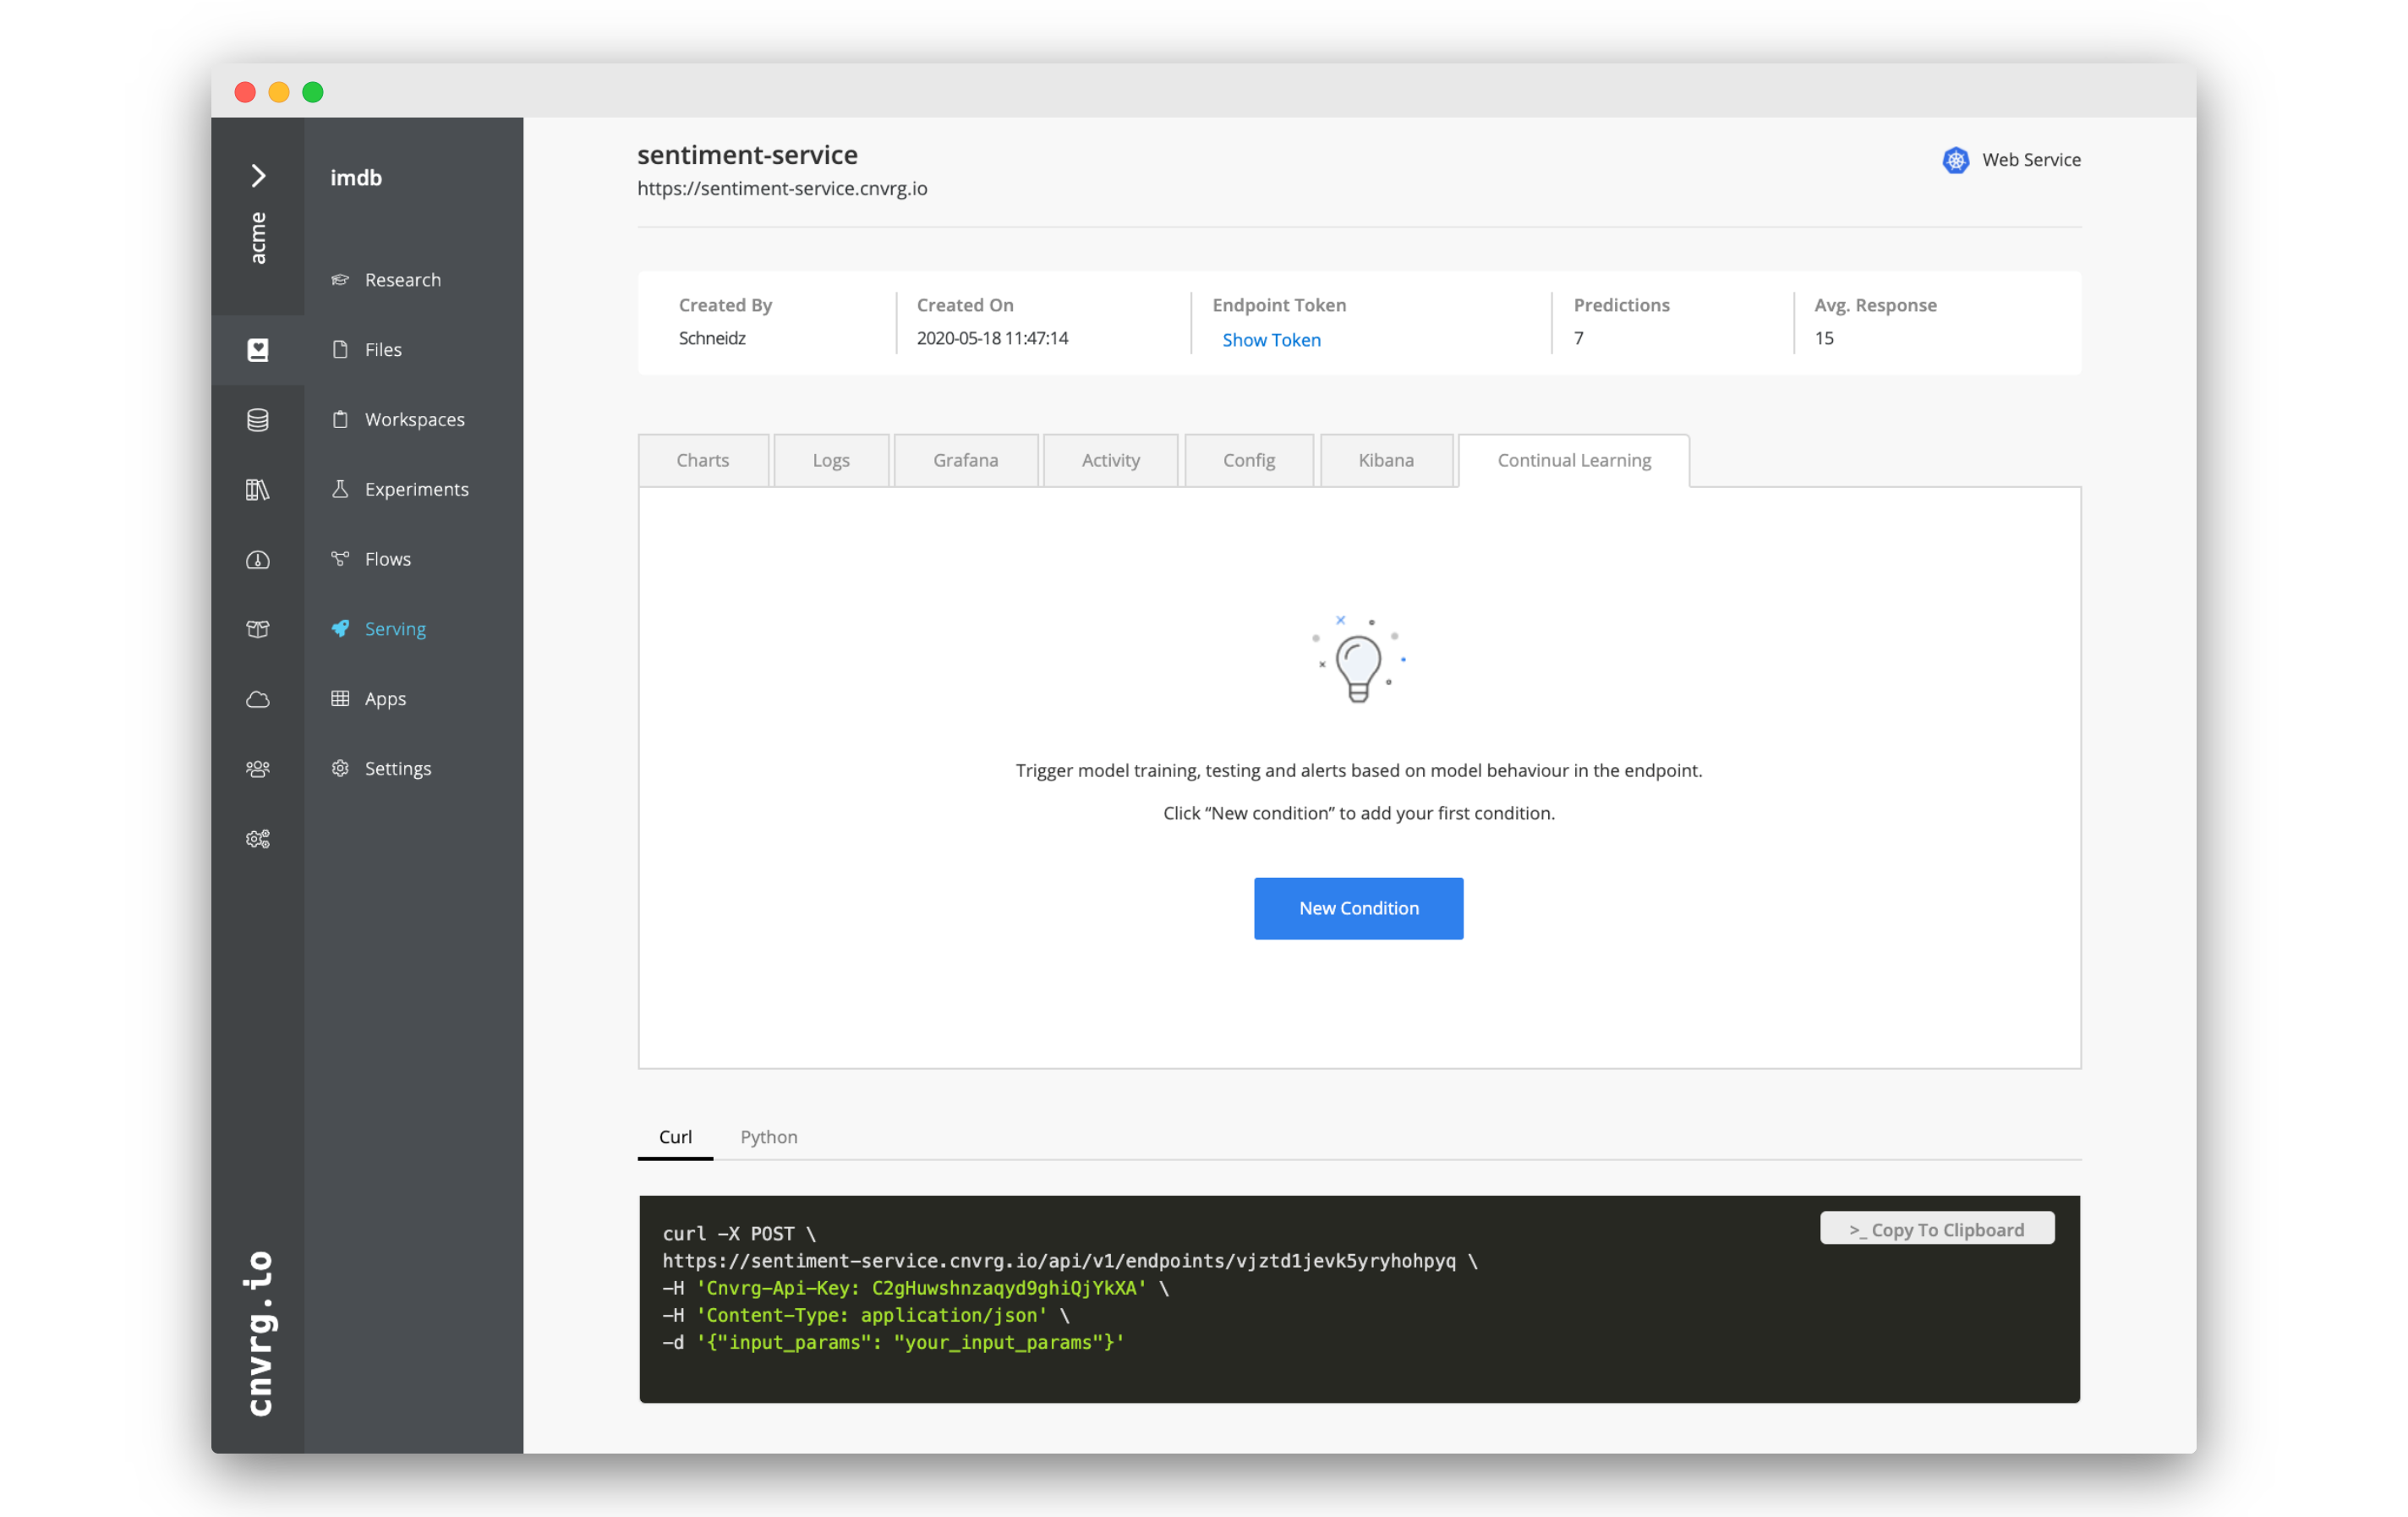
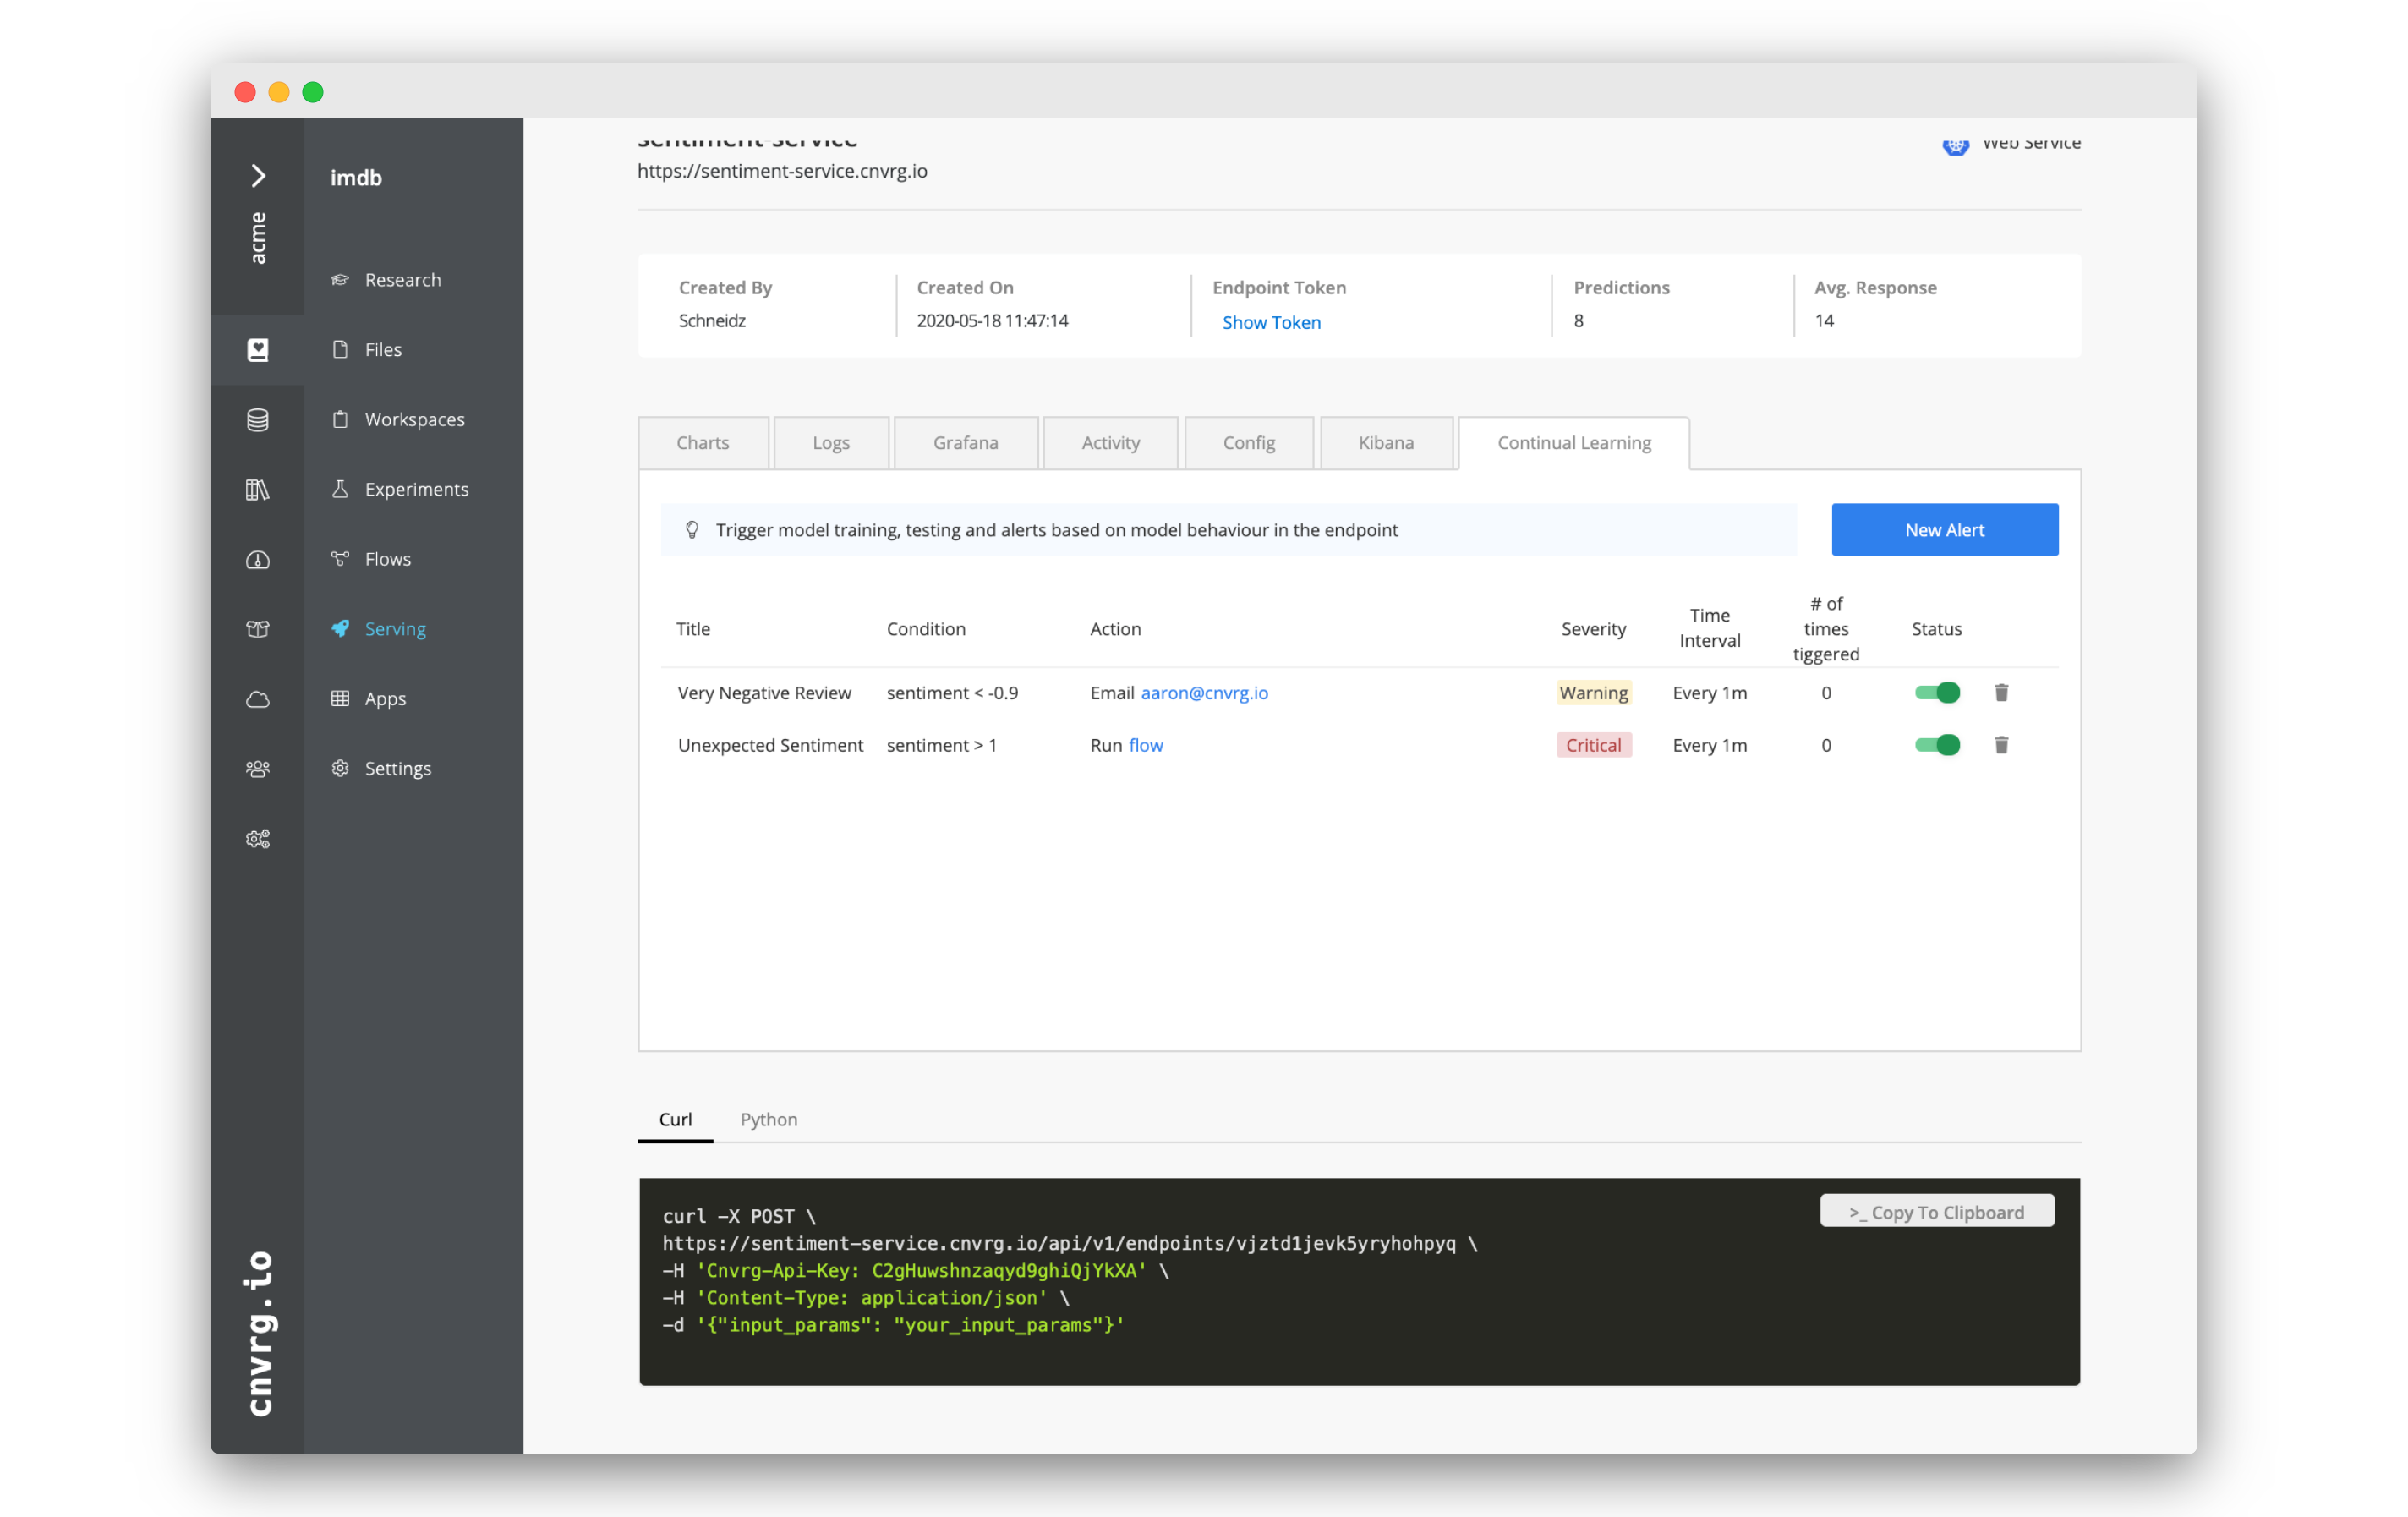
# Create Alerts and Triggers using Continual Learning
 Any metric that you are tracking using
 log_metric() can also be used to create alerts and triggers. In the Continual Learning tab, you can automate actions based on the actual performance of your service. You can easily set up email notifications or trigger flows, allowing you to stay informed, but also to automate the retraining and redeployment of your ML pipeline.
We will continue using the same example we created above to demonstrate.
# Create an alert
- Go to the Continual Learning tab of your endpoint.
- Click New Condition.
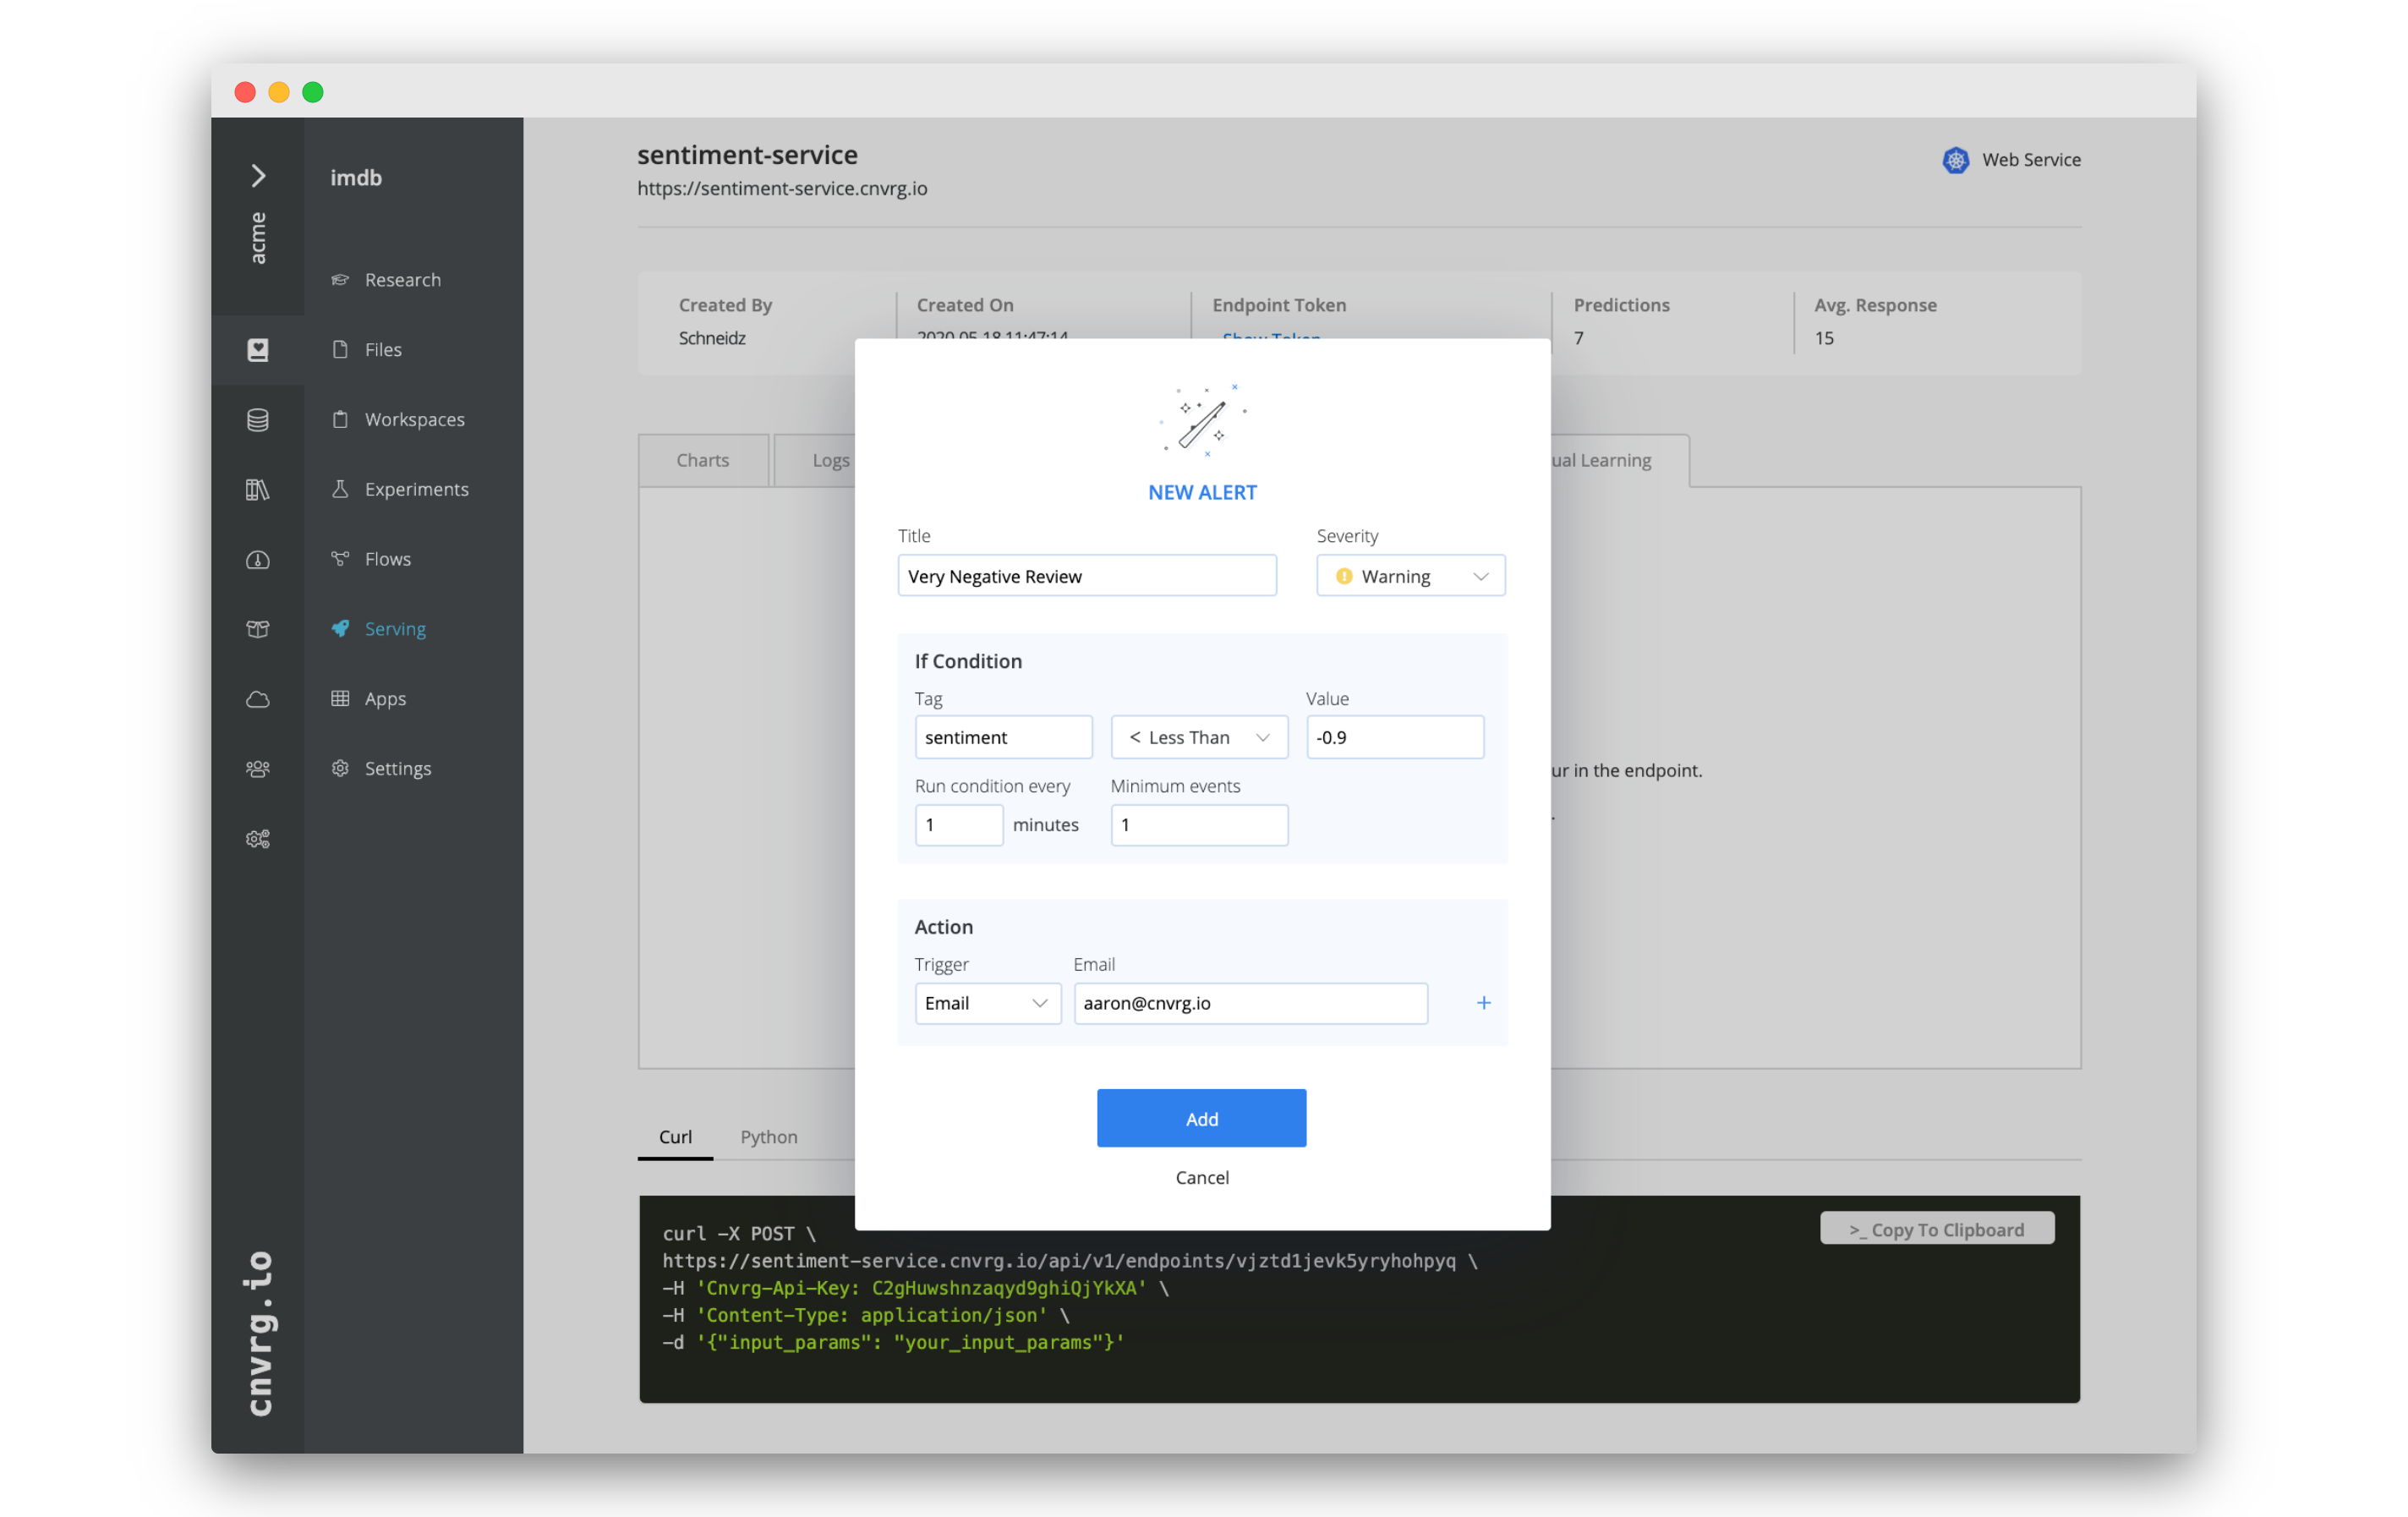
- In the New Alert box, fill in the following information:
- Title: Very Negative Review
- Severity: Warning
- Tag: sentiment
- < Less Than
- Value: -0.9
- Run condition every: 1 minutes
- Minimum events: 1
- Trigger: Email
- Email: your email address
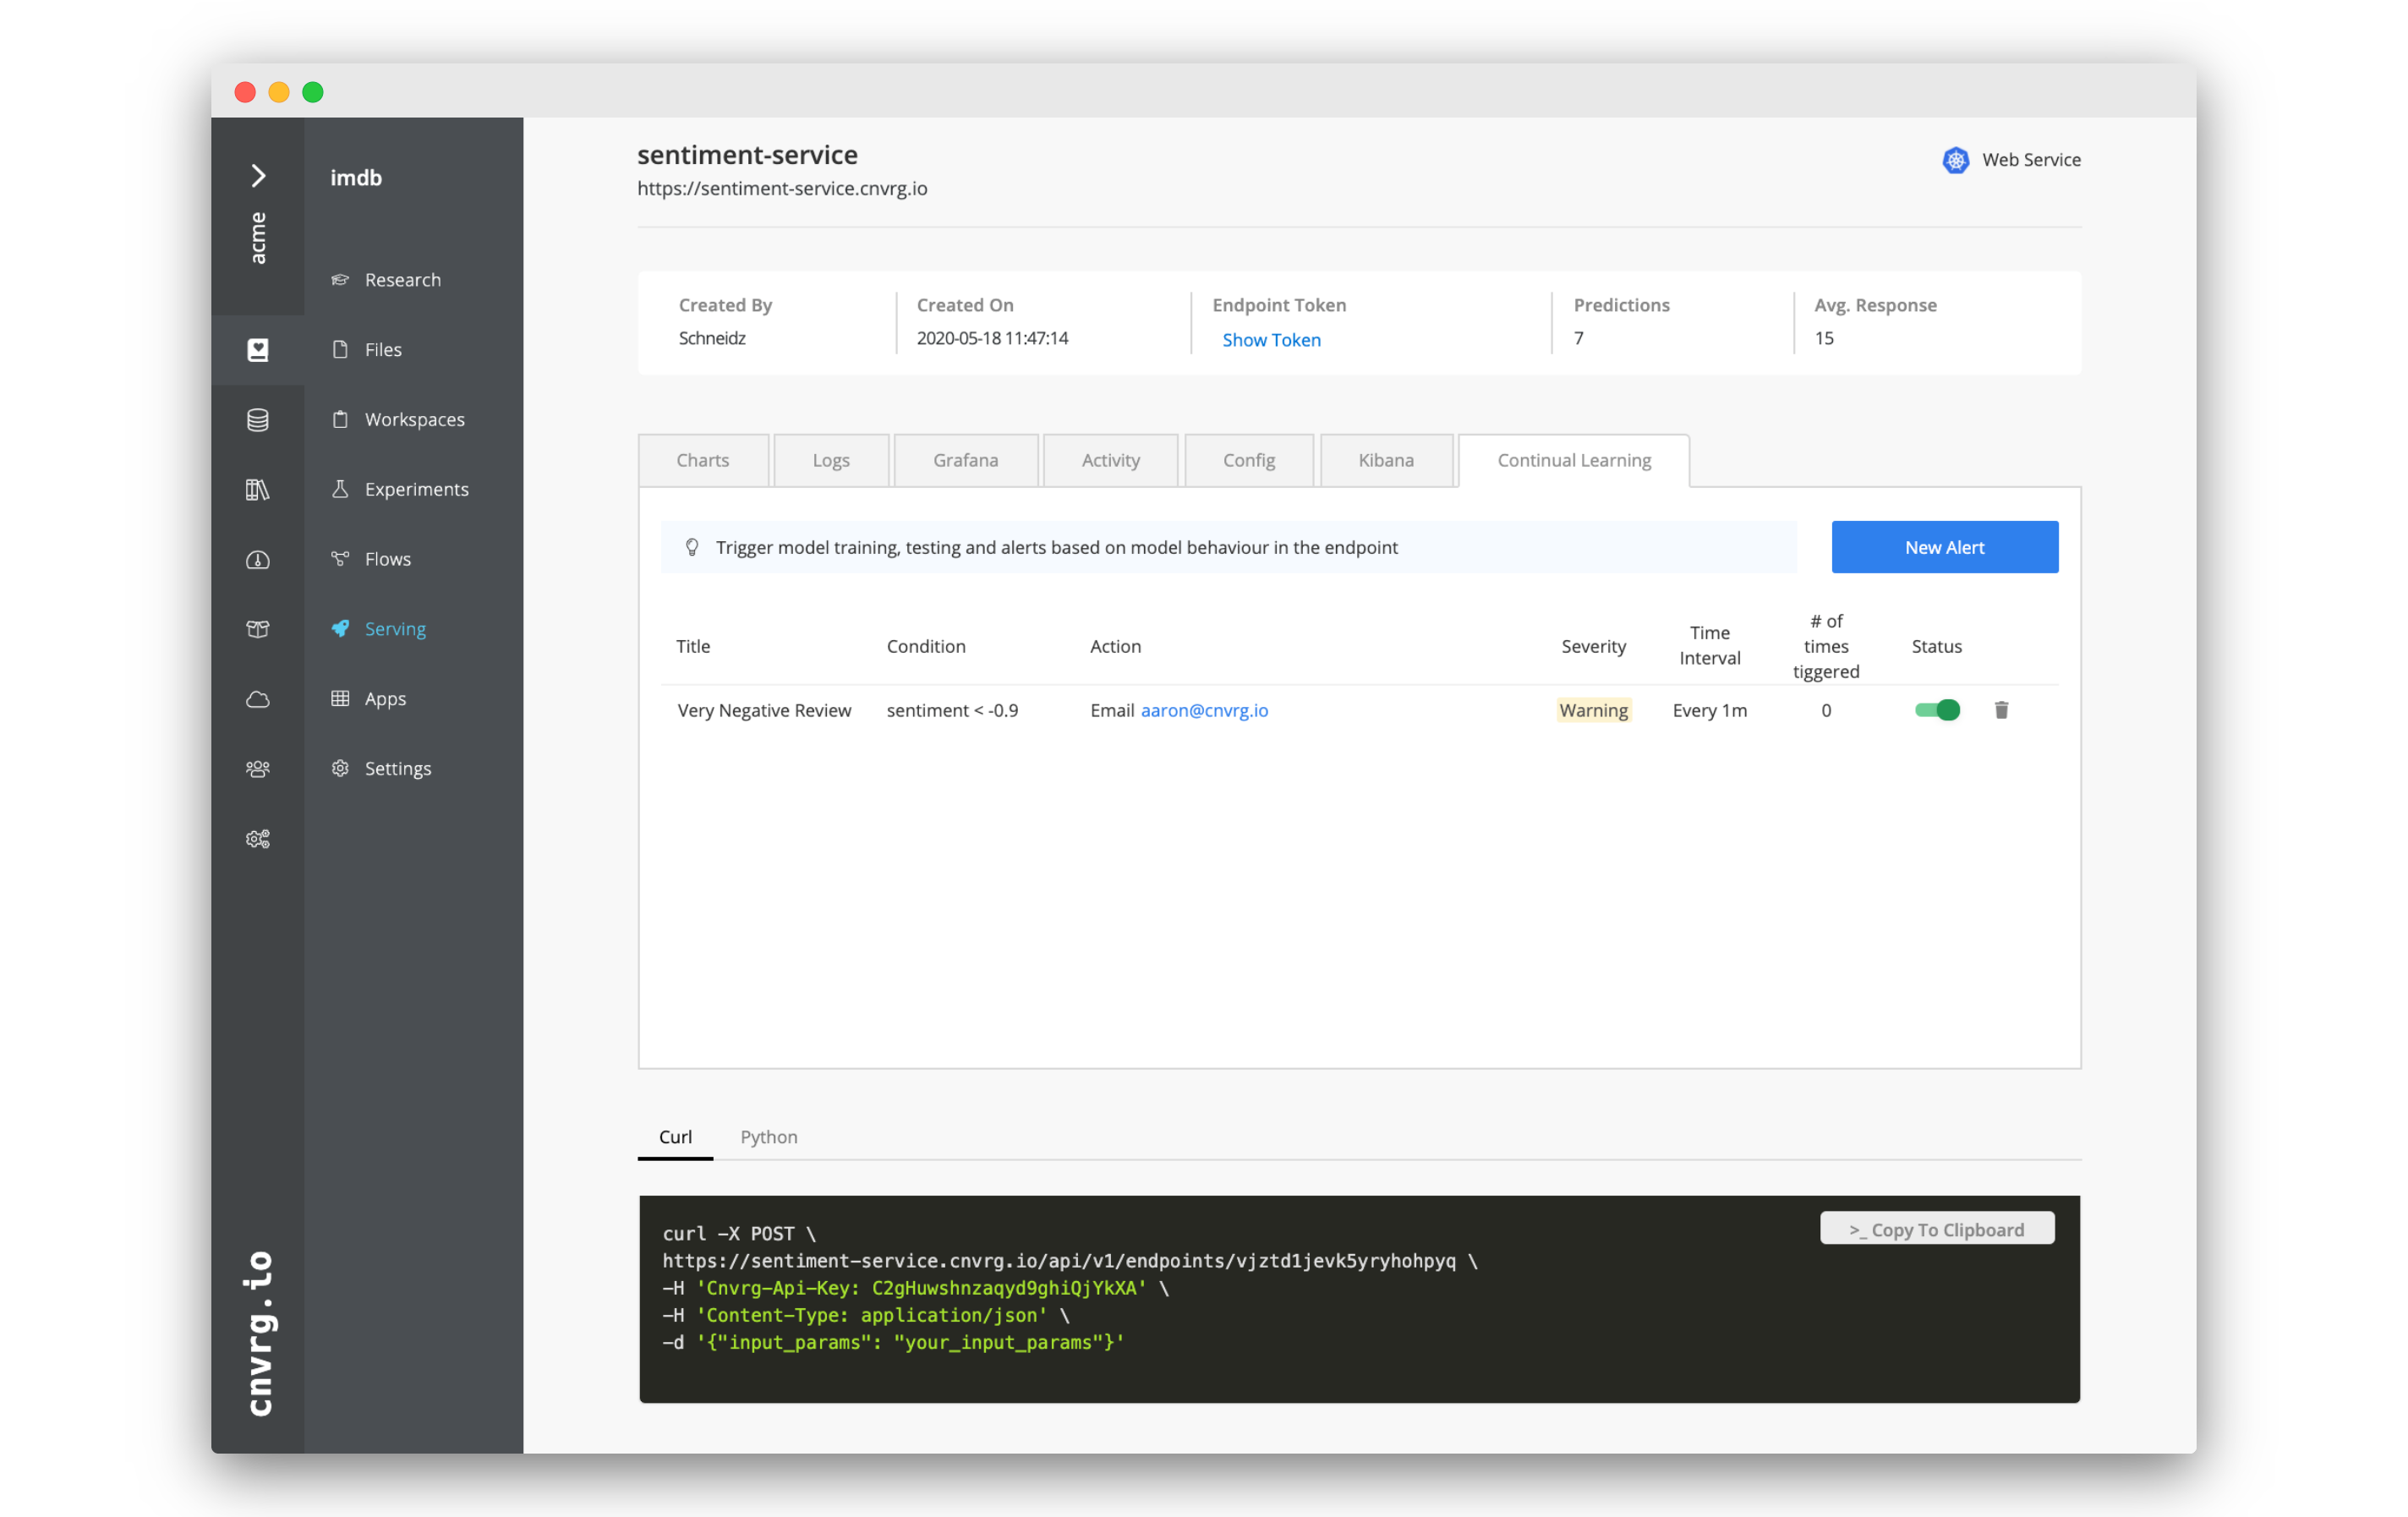
- Click Add.
You will now have set up an email alert. When an extremely negative review is analyzed, you will receive an email! You can test the functionality by submitting an extremely negative review.
# Create a trigger to run a flow
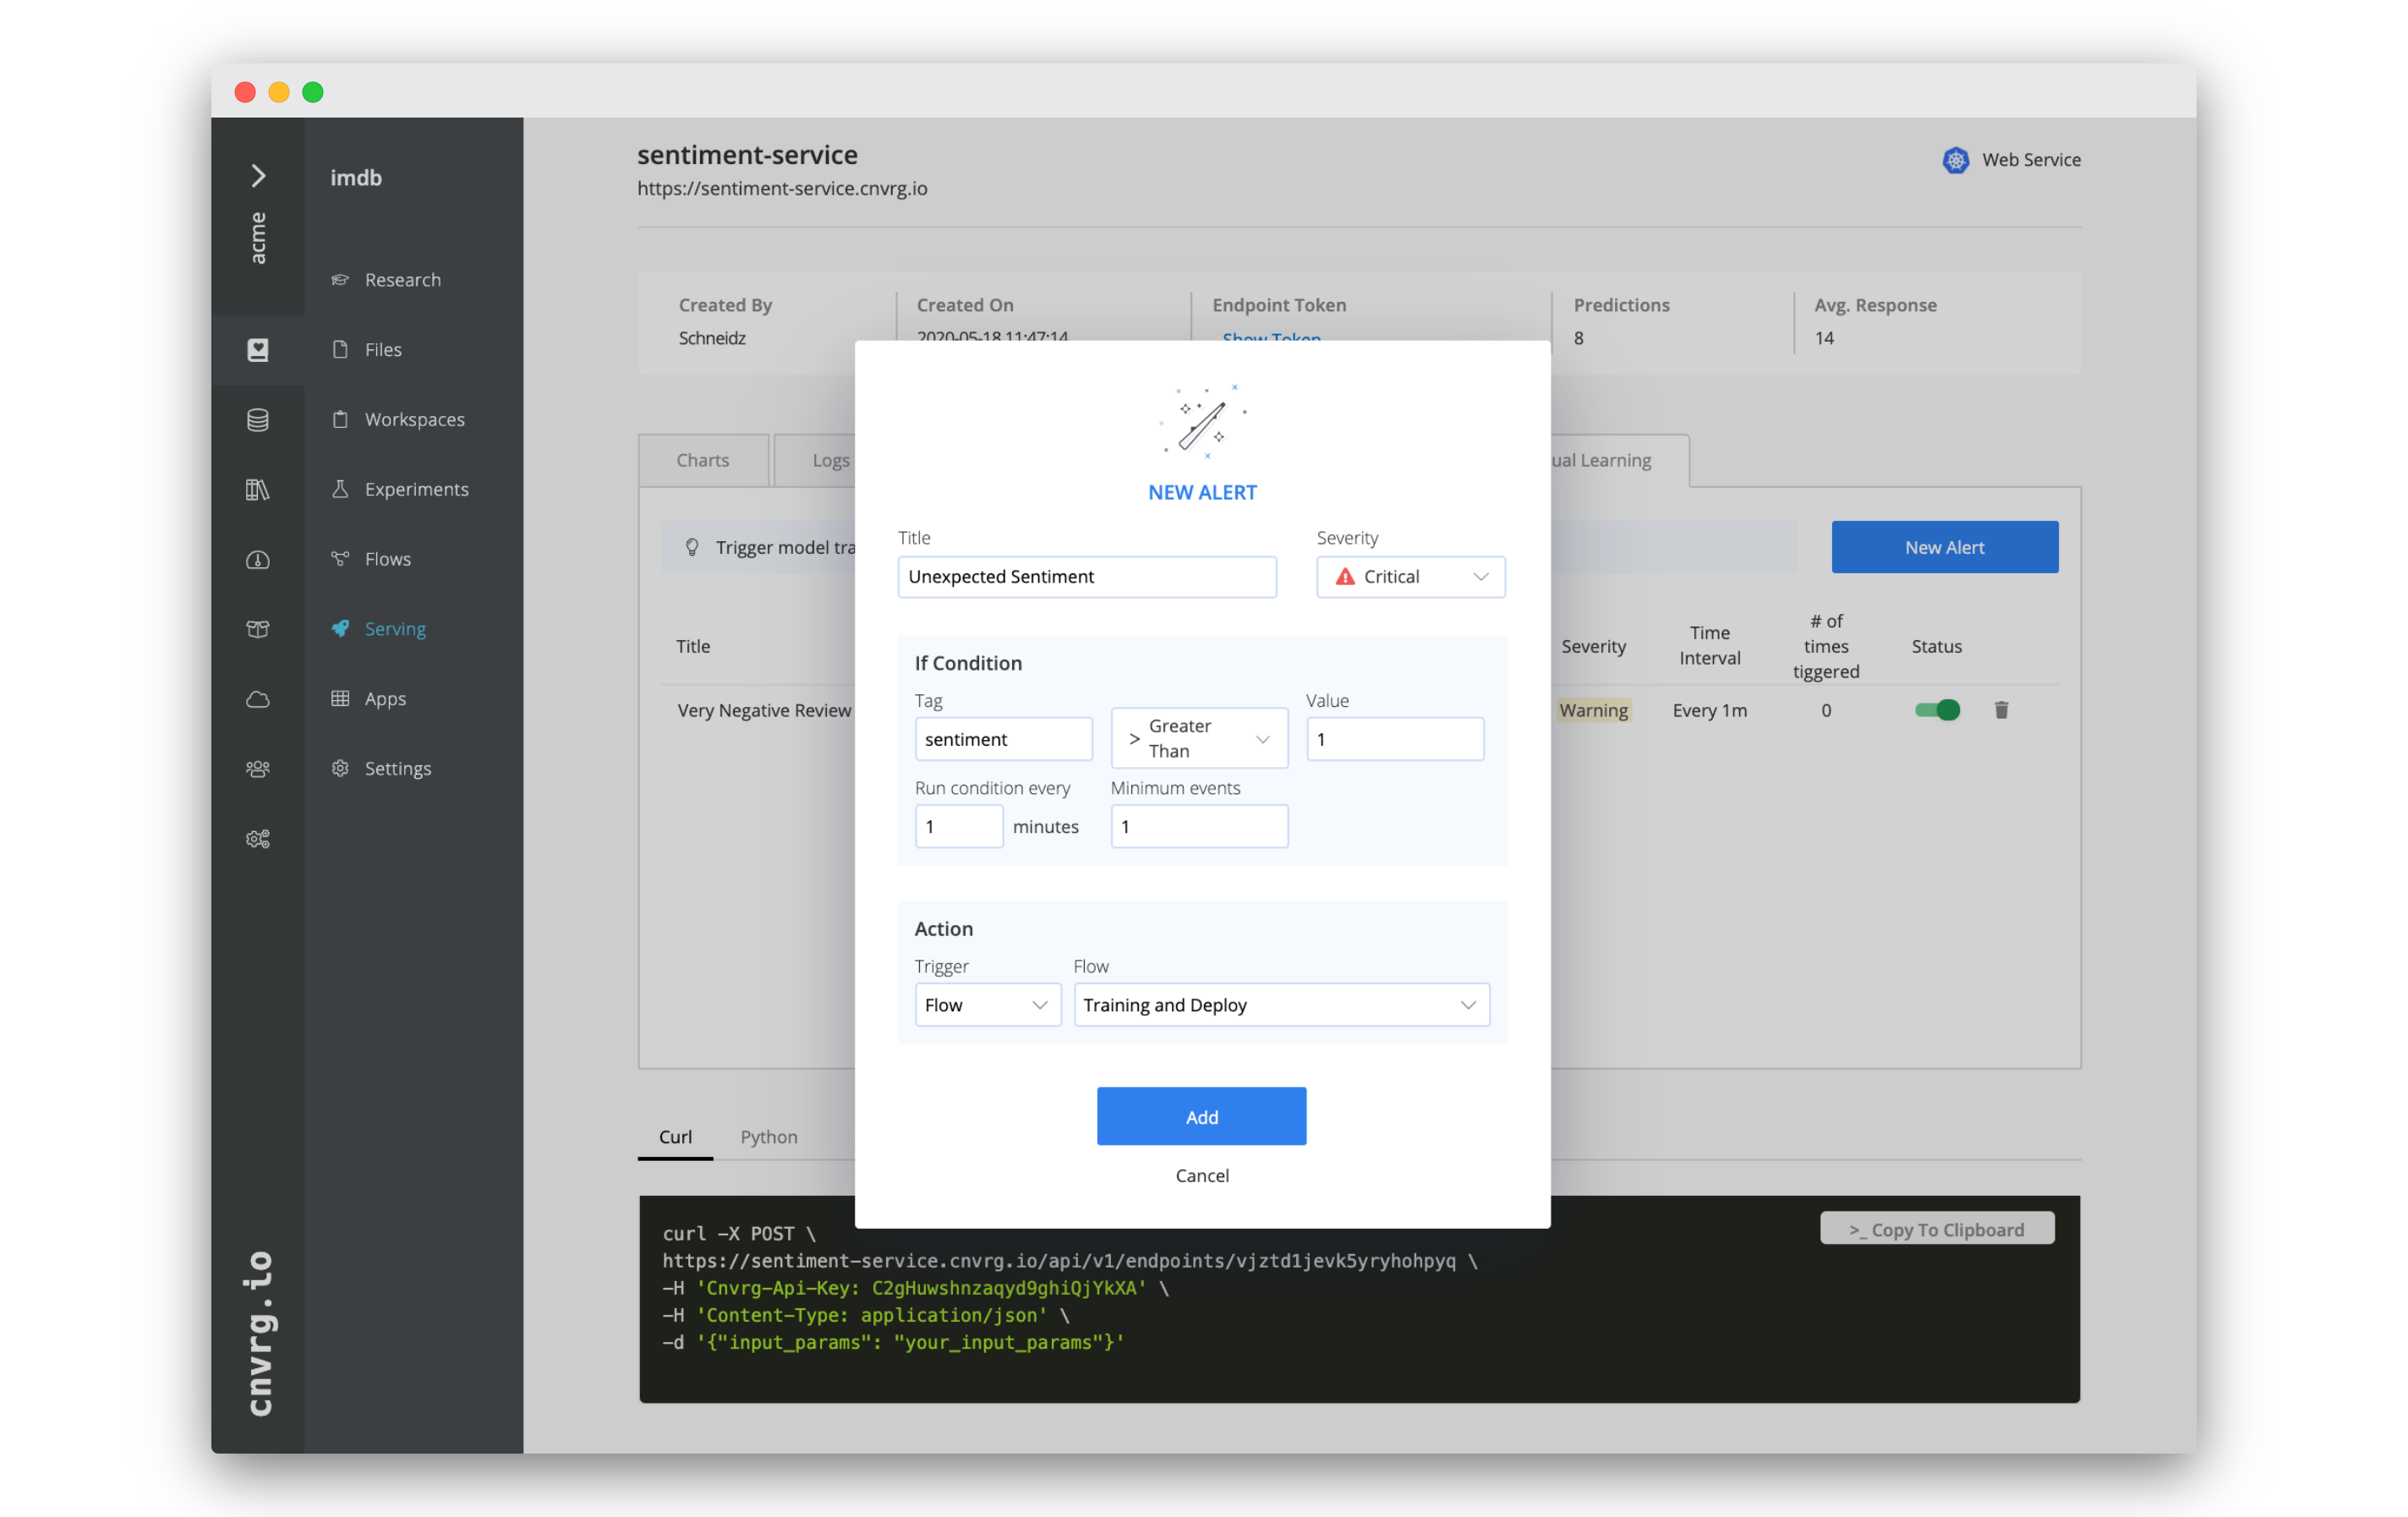
- On the Continual Learning tab of your endpoint, click New Condition.
- In the New Alert box, fill in the following information:
- Title: Unexpected Sentiment
- Severity: Critical
- Tag: sentiment
- > greater Than
- Value: 1
- Run condition every: 1 minutes
- Minimum events: 1
- Trigger: Flow
- Email: Training and Deploy
- Click Add.
You just created a trigger. When a sentiment is recorded that is higher than 1, the chosen flow will be run, a new grid search will be triggered and an updated model rolled into production.
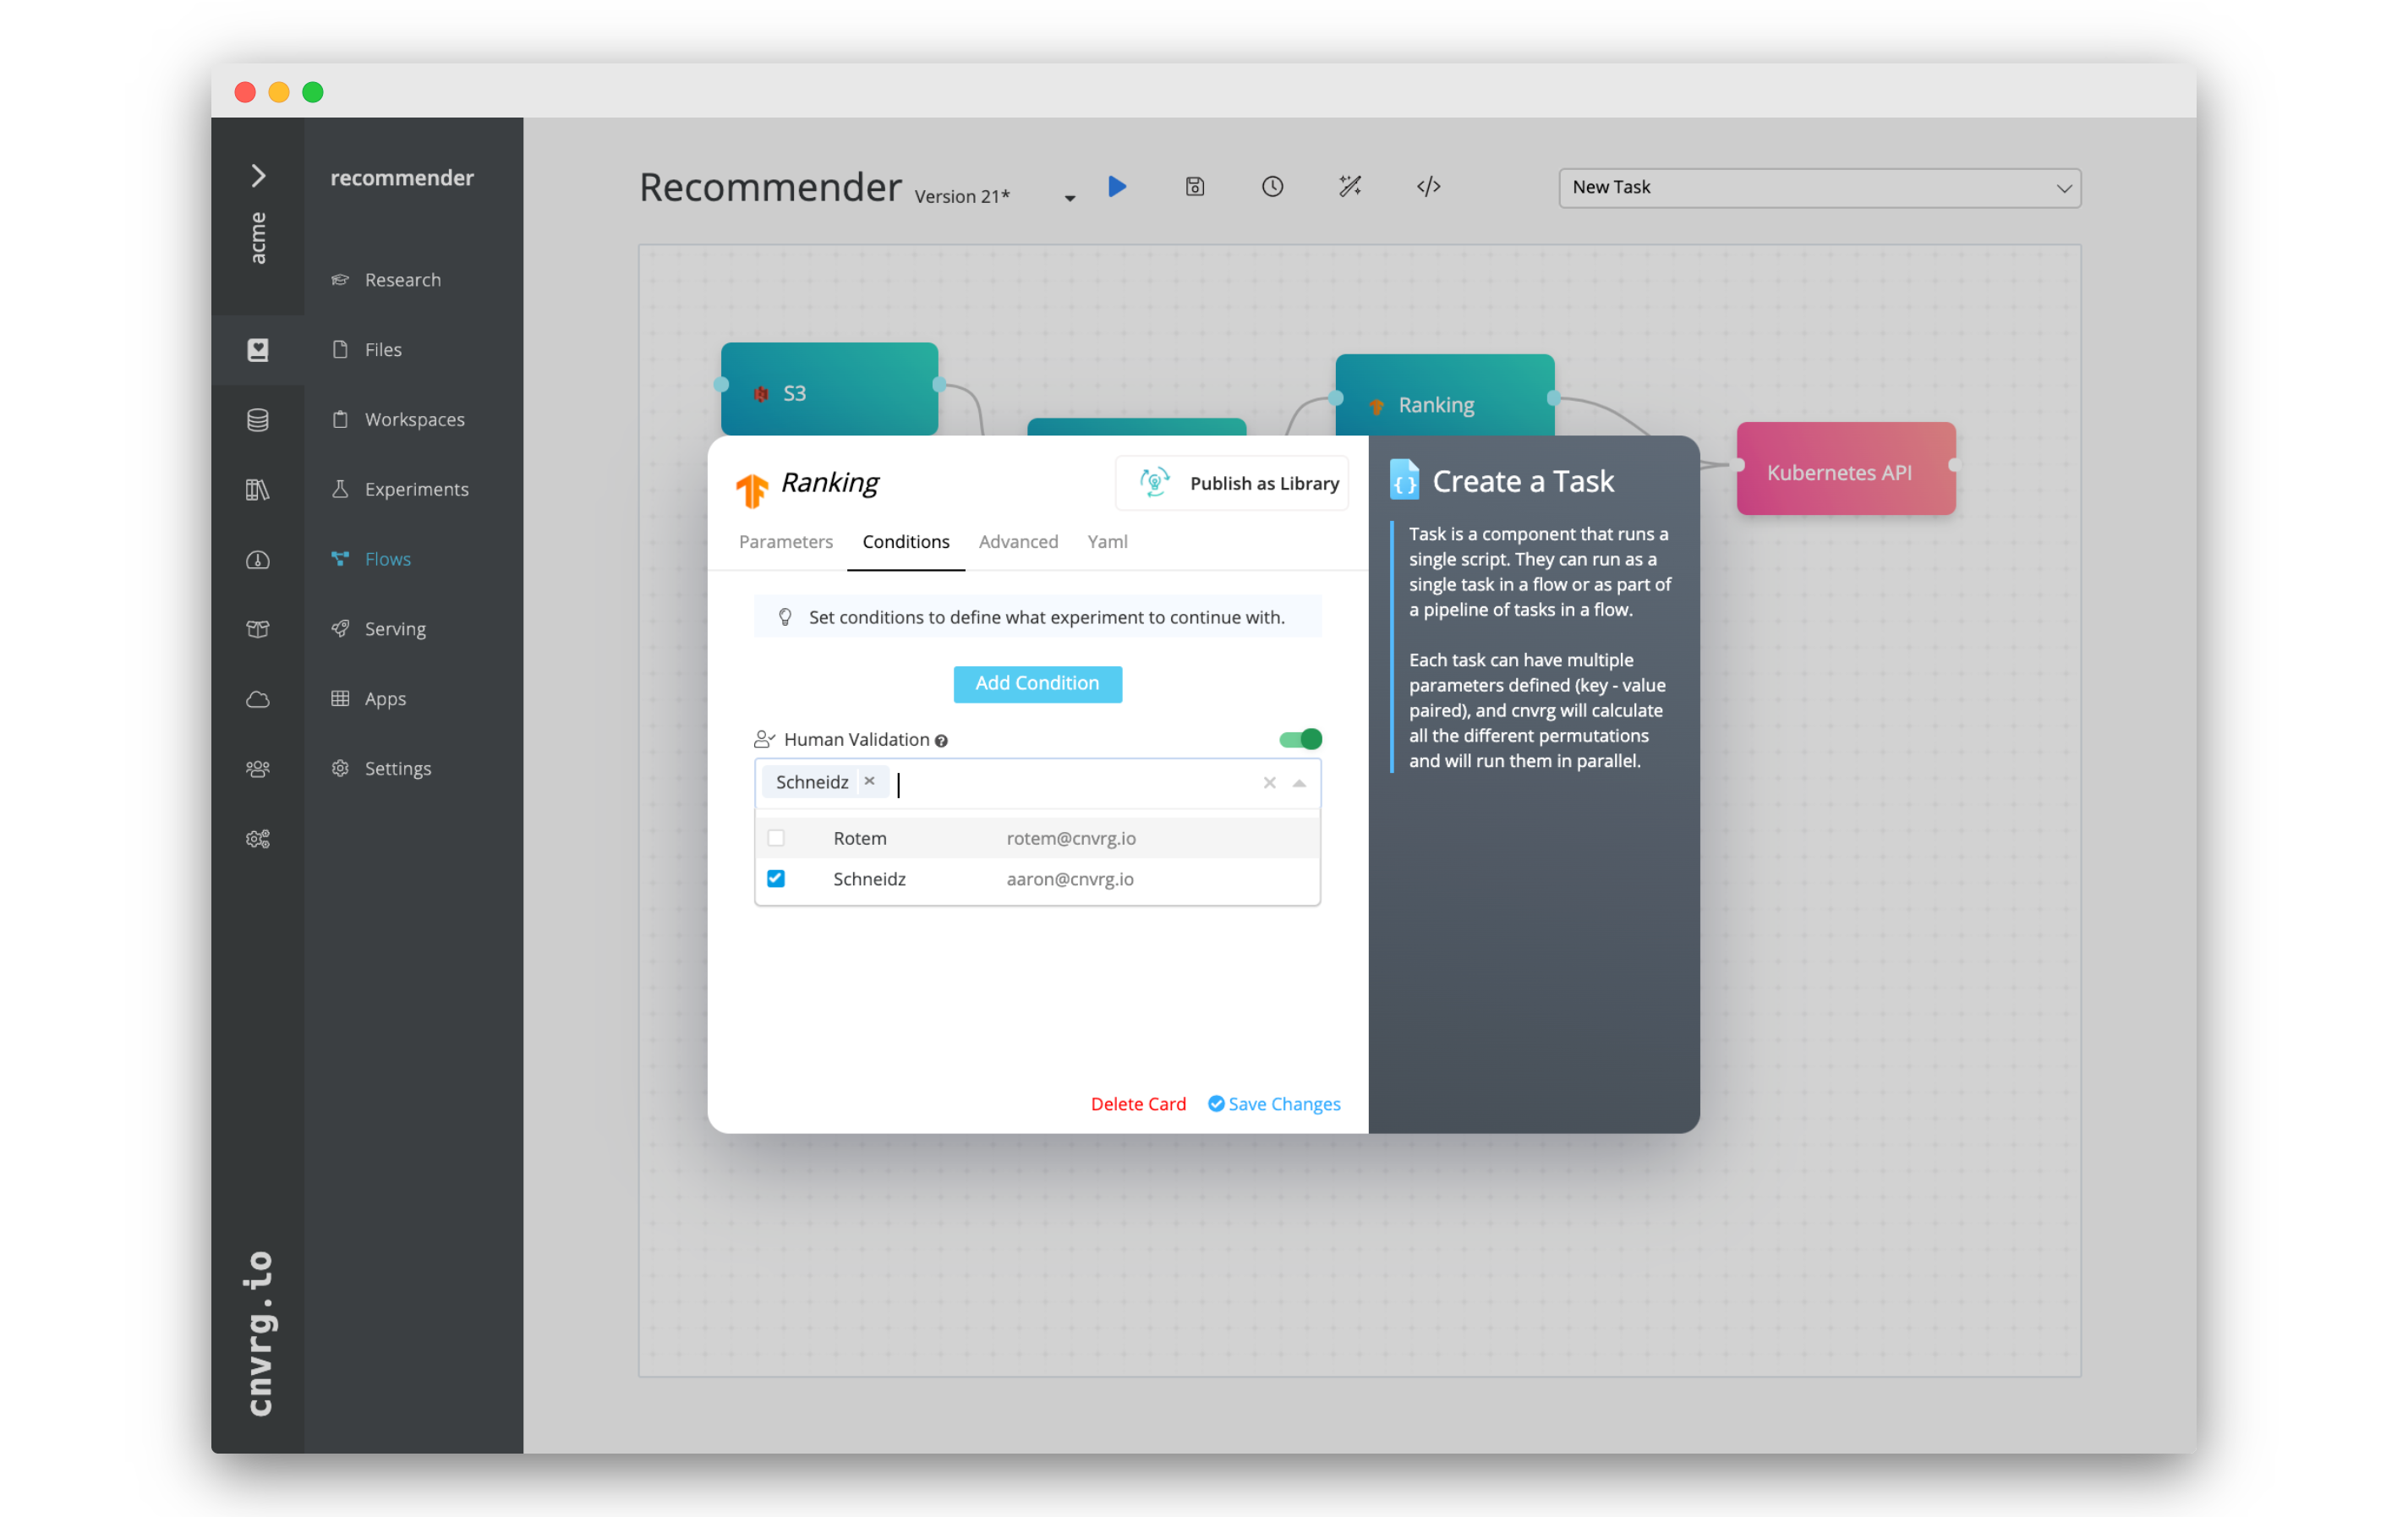
# Alert and trigger possibilities
Continual learning allows you to create your own CICD pipeline and trigger complex ML pipelines. You can really run any code or task in a flow, and even update existing services with canary deployment, allowing you to build a custom solution for monitoring and retraining your service on the latest version of your dataset. You can also use Human Validation to ensure nothing happens without the necessary administrative oversight.
# Export Endpoint Data with a Feedback Loop
When a service is in production, it is being used on real data. Especially in use case involving live services and Kafka streaming, authentic user data is coming into the endpoint and used for predictions. This data can be incredibly useful for research and building out your existing dataset.
That is why cnvrg has Feedback Loops. Feedback Loops allow you to manually or automatically export the data (inputs, predictions and so on) from the endpoint into a cnvrg dataset.
We will continue using the same example we created above to demonstrate.
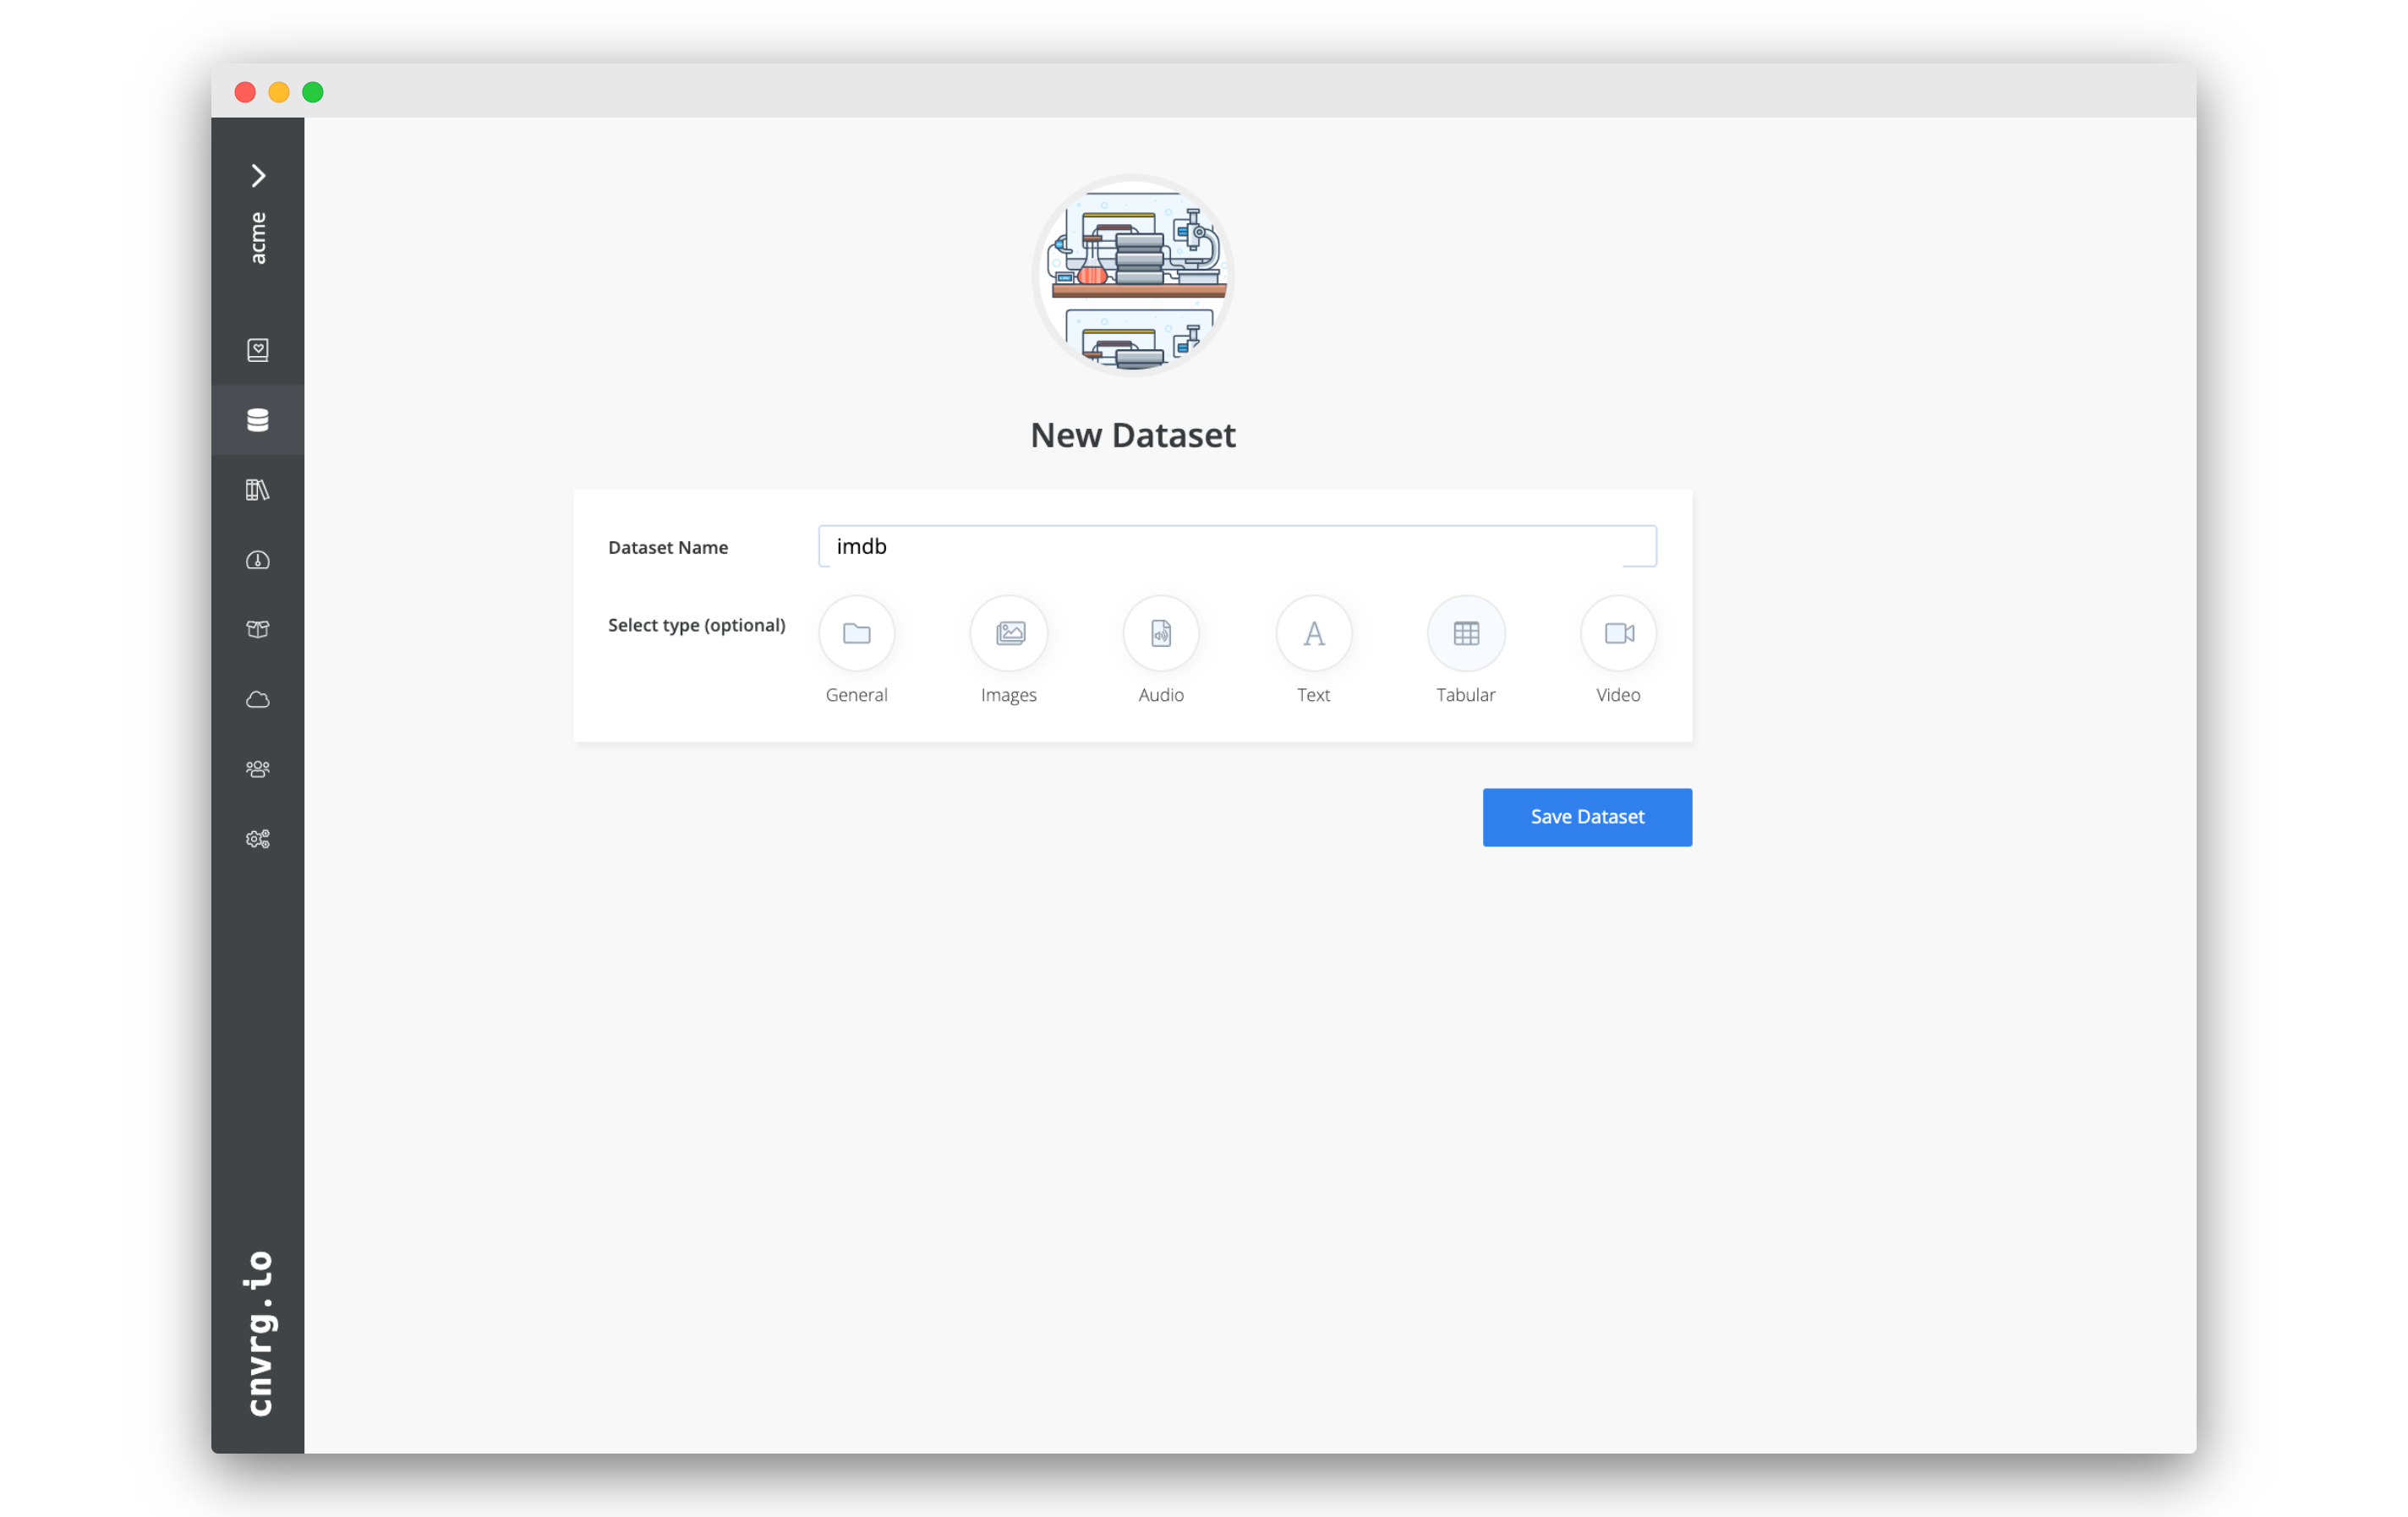
# Create a new dataset
 You will need to have a dataset in cnvrg to export the data to. If you have already created one that you are happy to use, you can skip this step.
- Go to the Datasets tab.
- Click + New Dataset.
- In the dataset setup page, set:
- Dataset Name: imdb
- Type: Tabular
- Click Save Dataset.
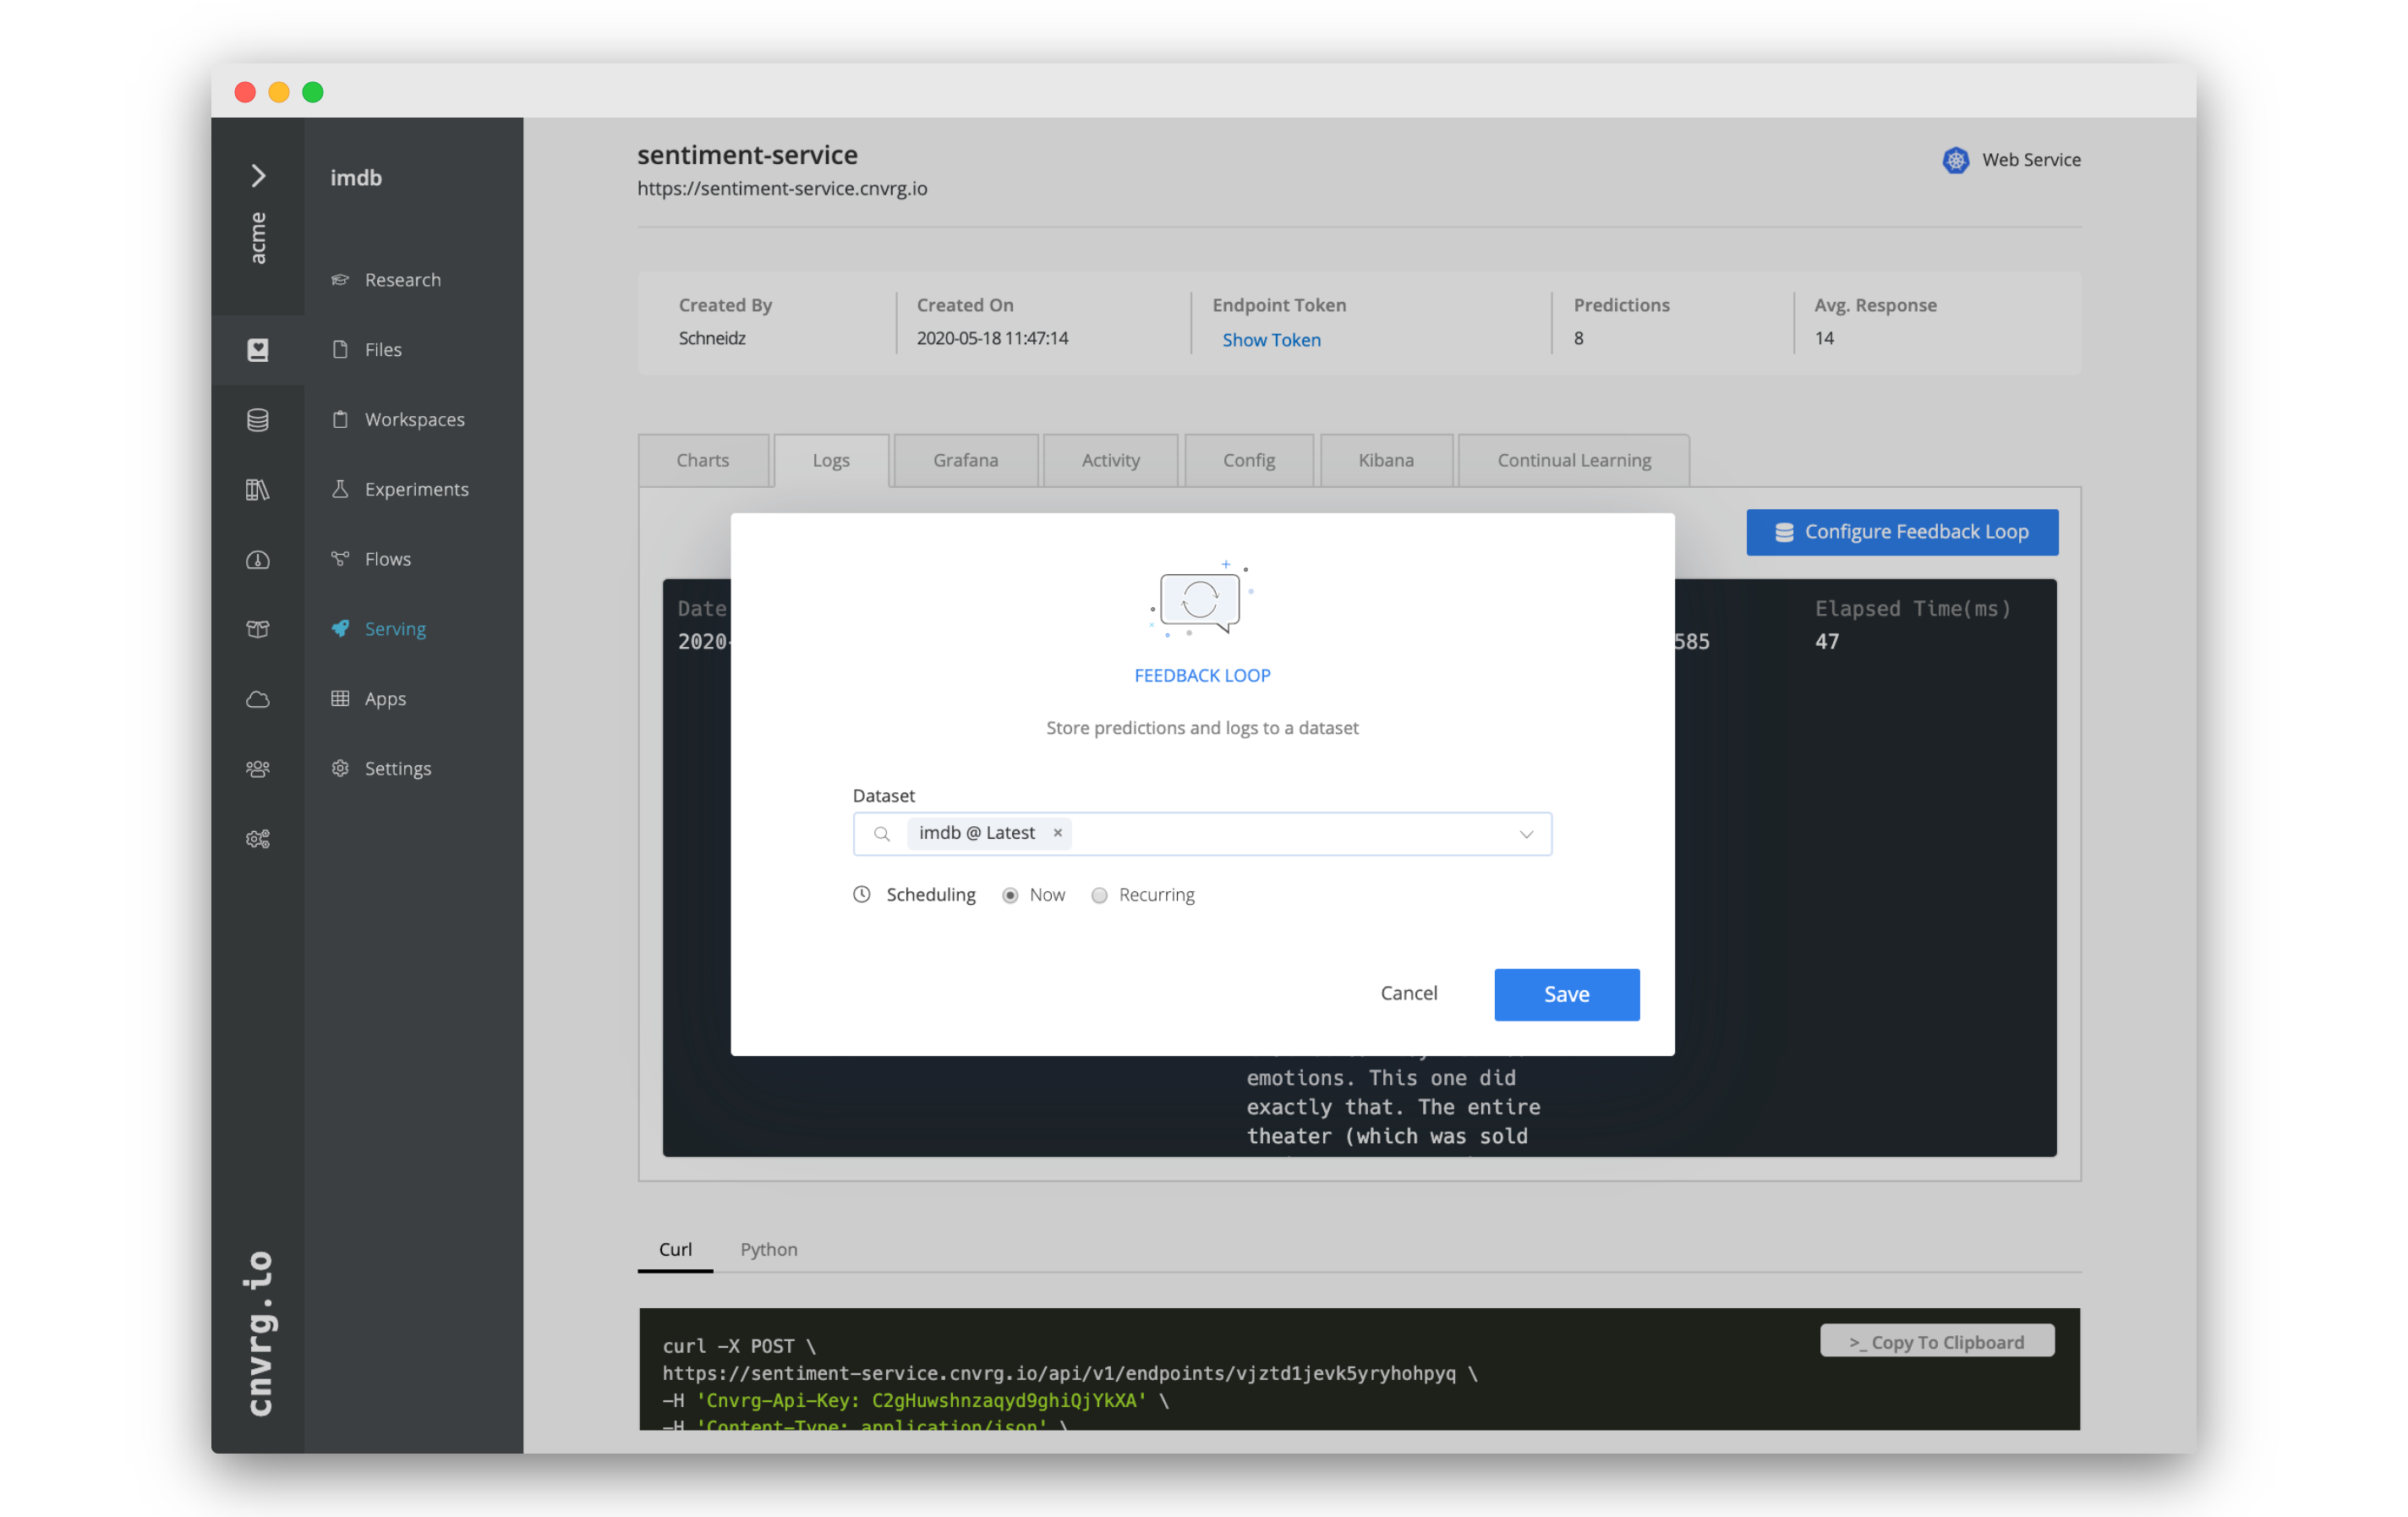
# Create a Feedback Loop
 Let's create a feedback loop for our existing Sentiment Service.
- Go into your IMDB project > Serving > Sentiment Service.
- Go to the Logs tab of the endpoint. Here you can see all the data from your service.
- To create a Feedback Loop, click Configure Feedback Loop.
- In the Feedback Loop box:
- Dataset: imdb (or another you want to use)
- Scheduling: Now
- Click Save.
The Feedback Loop will start running and the endpoint data will be exported into the imdb dataset.
# Recurring Feedback Loops
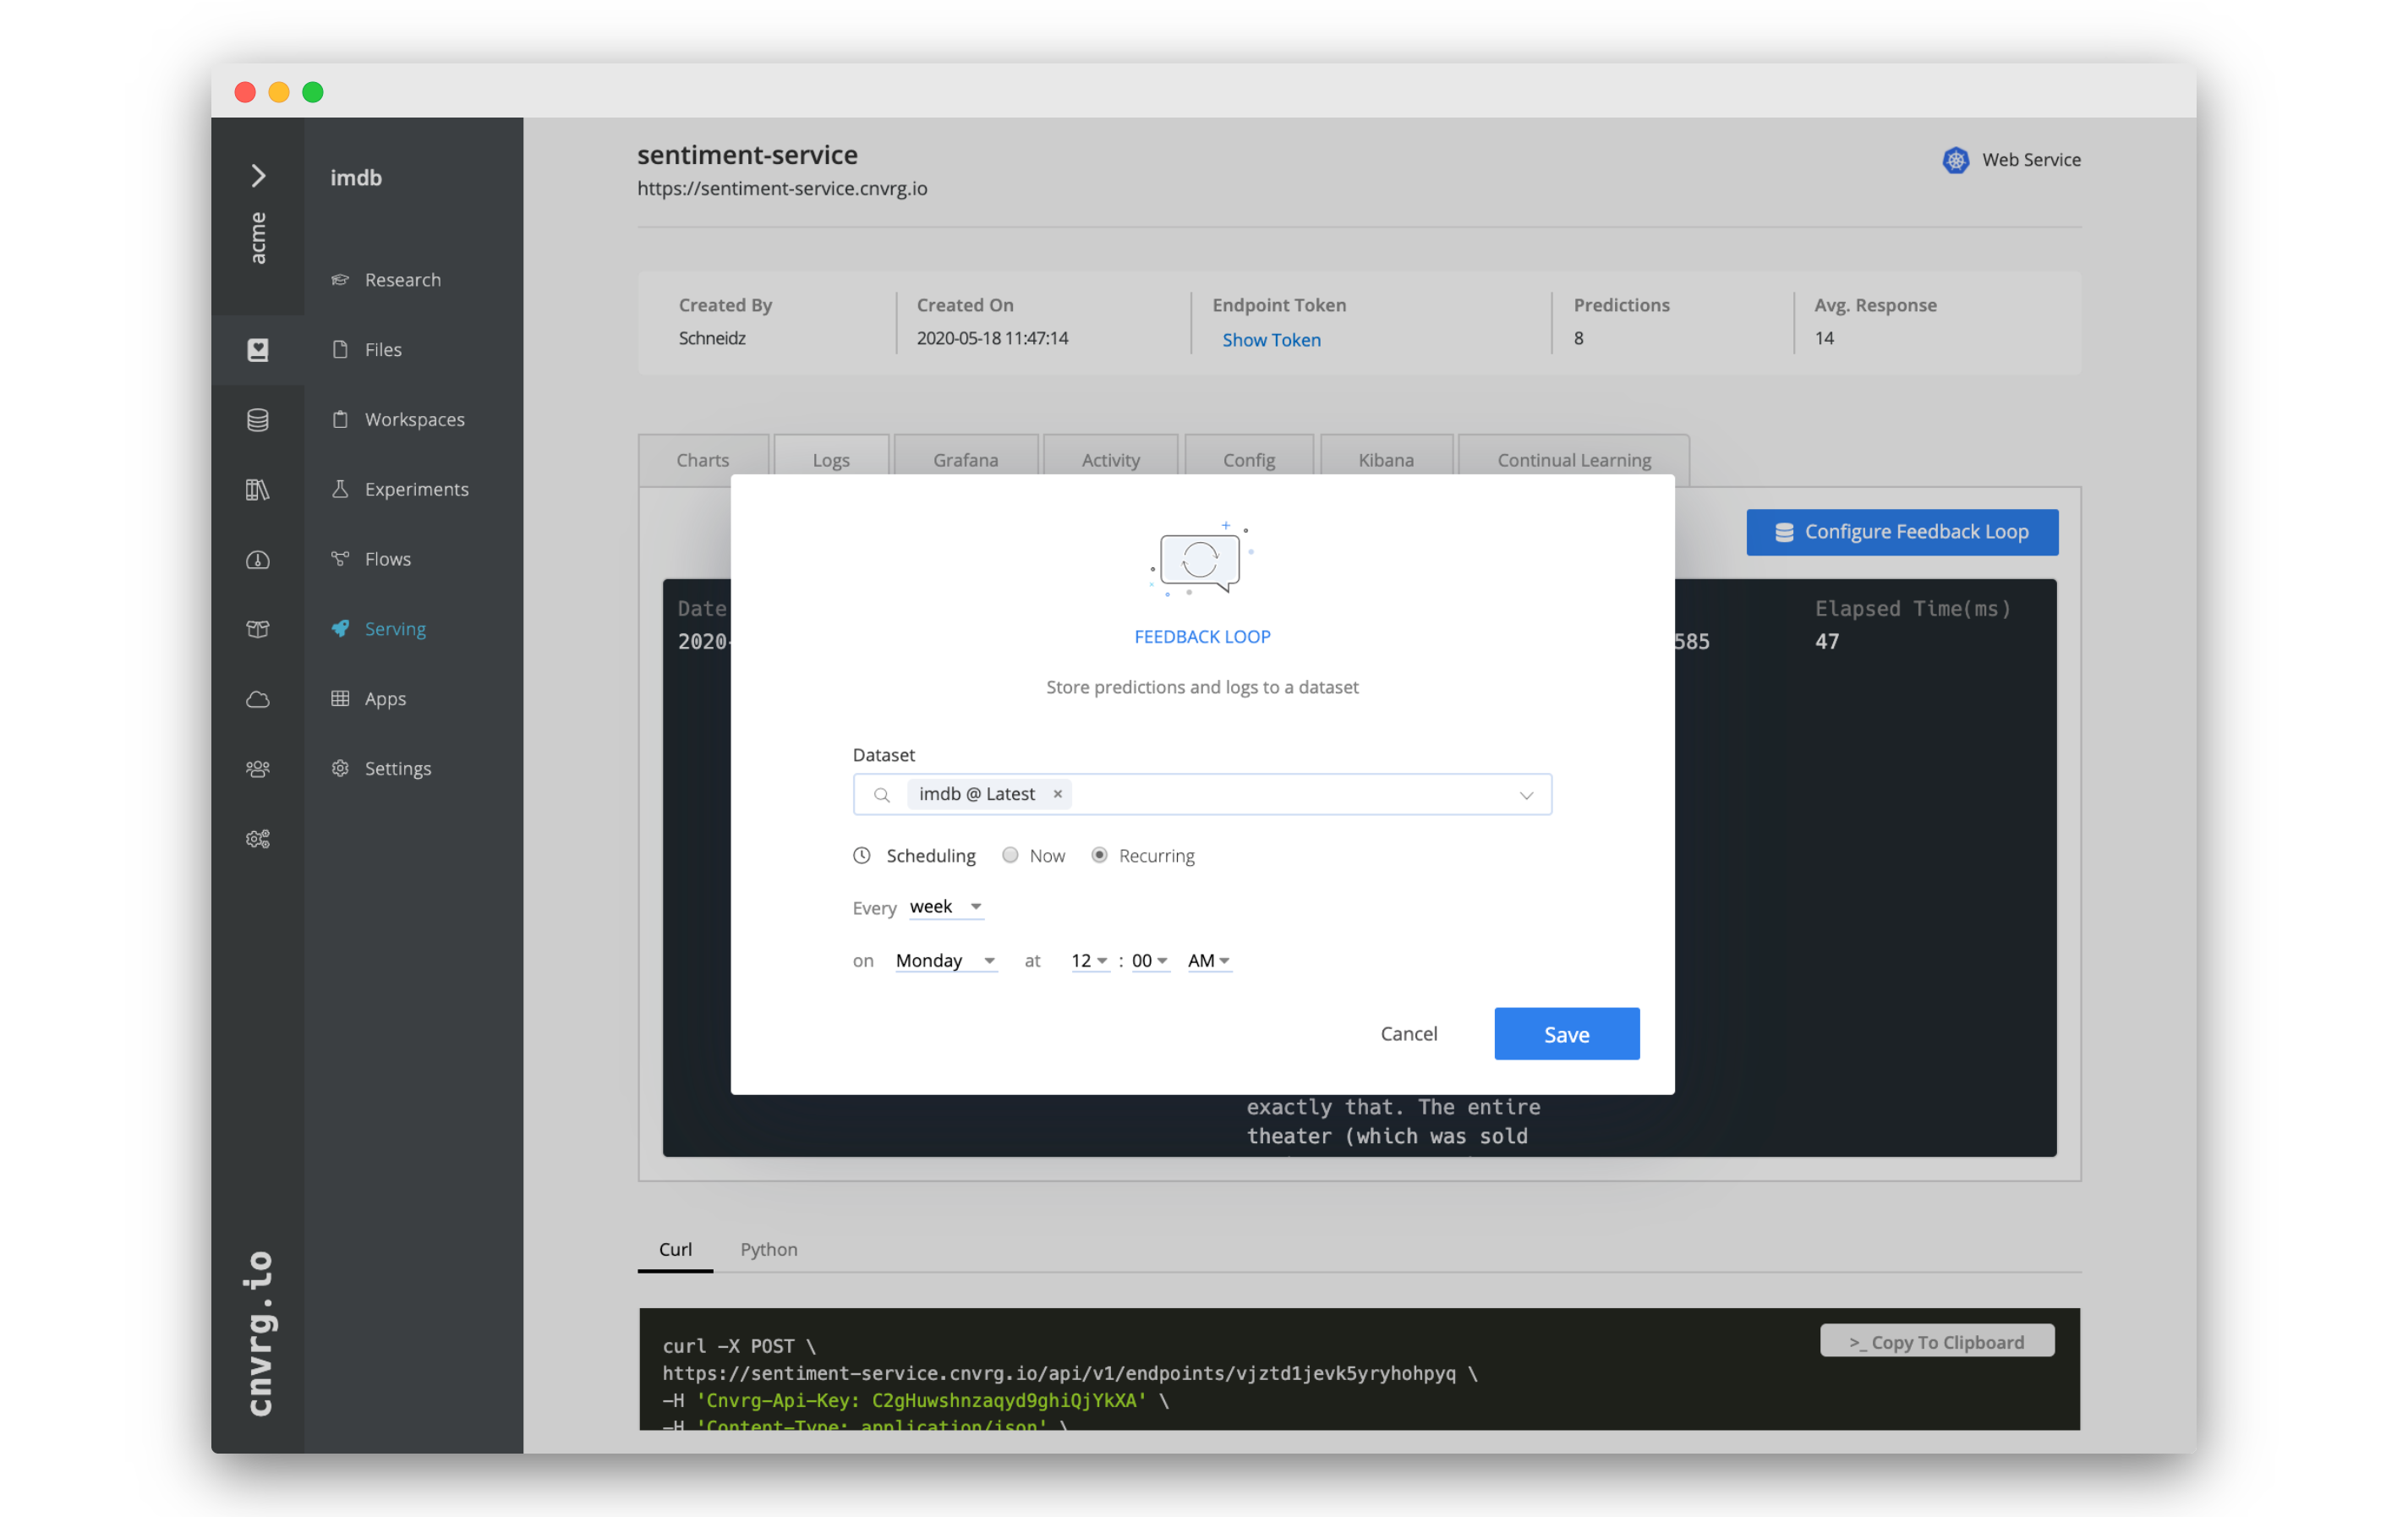 You may have noticed that you could have set the Feedback Loop to recur when configuring it. This would allow you to set a frequency at which the endpoint data will be exported, allowing you to automate the extraction of the data.
You can set it to be:
- Every minute
- Every hour
- Every day
- Every week
- Every month
- Every year
In each of the above options you can also configure when exactly the Feedback Loop runs.
We have not made one now as this tutorial is just for demonstrative purposes, no need to make the data here scheduled to continually export.
# Check the exported data
 Finally, let's check the data that was exported from the endpoint.
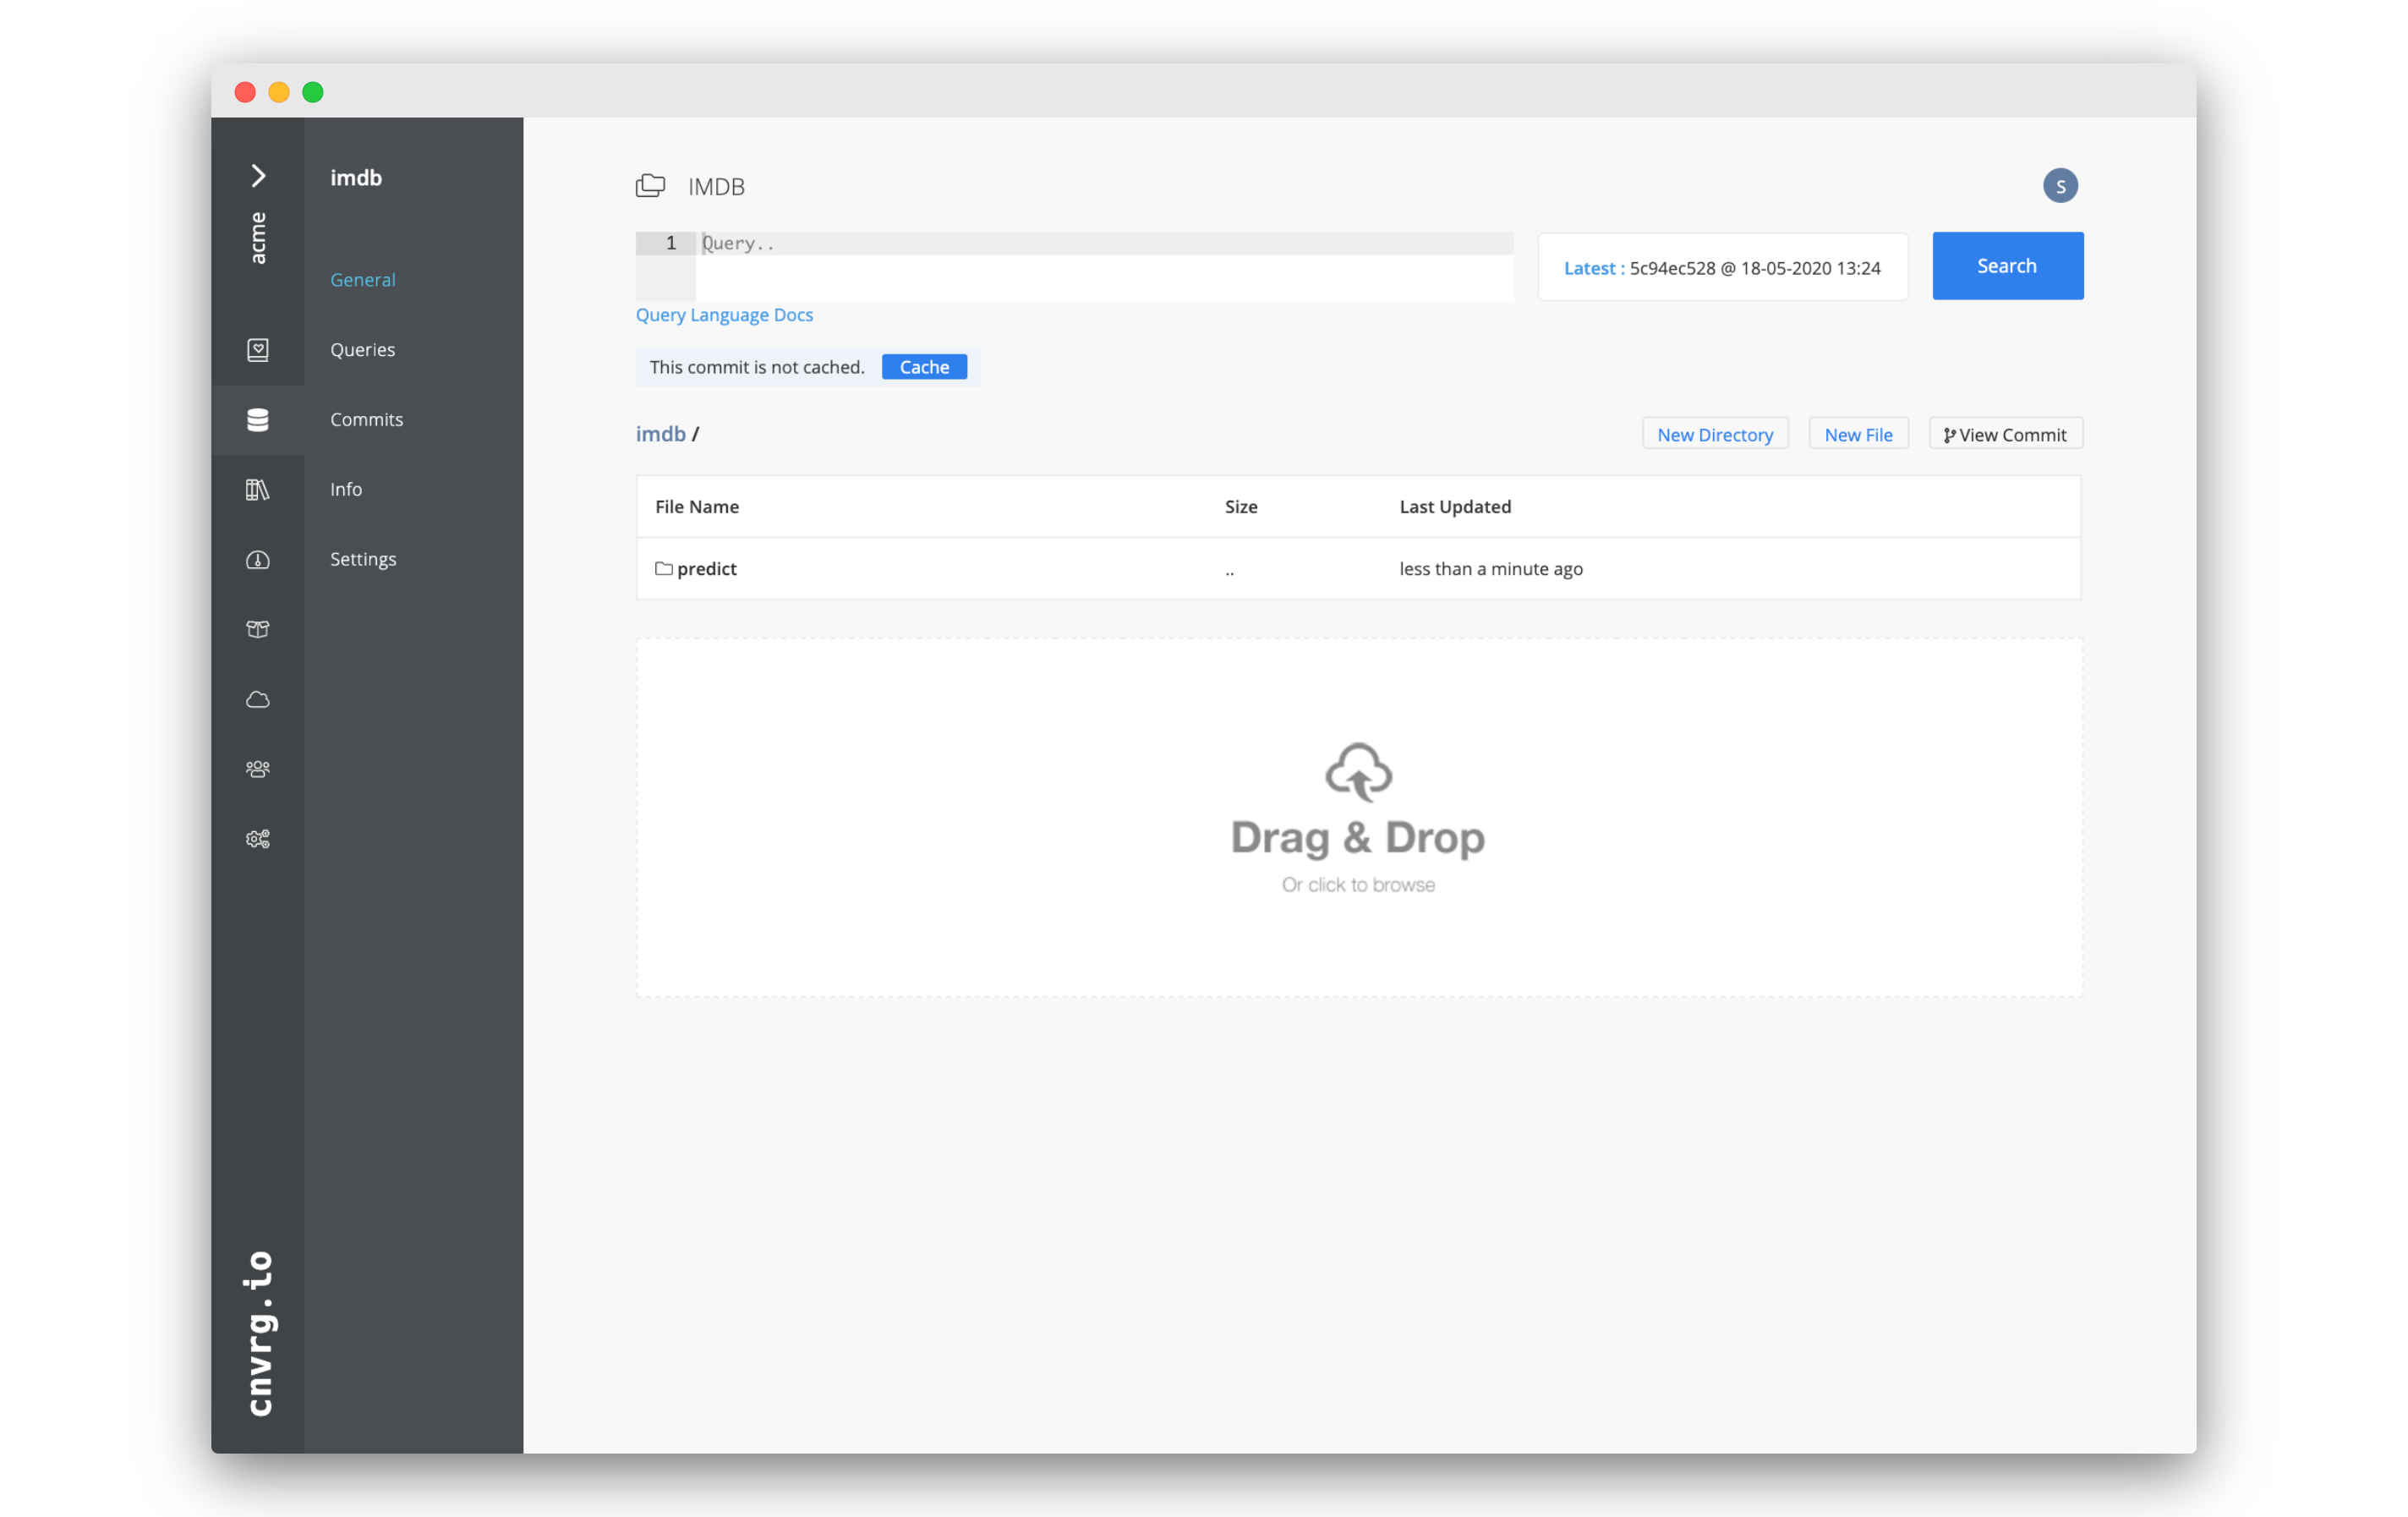
- Go to the Datasets tab.
- Click imdb or the dataset you chose.
- You should see a new folder named Predict.
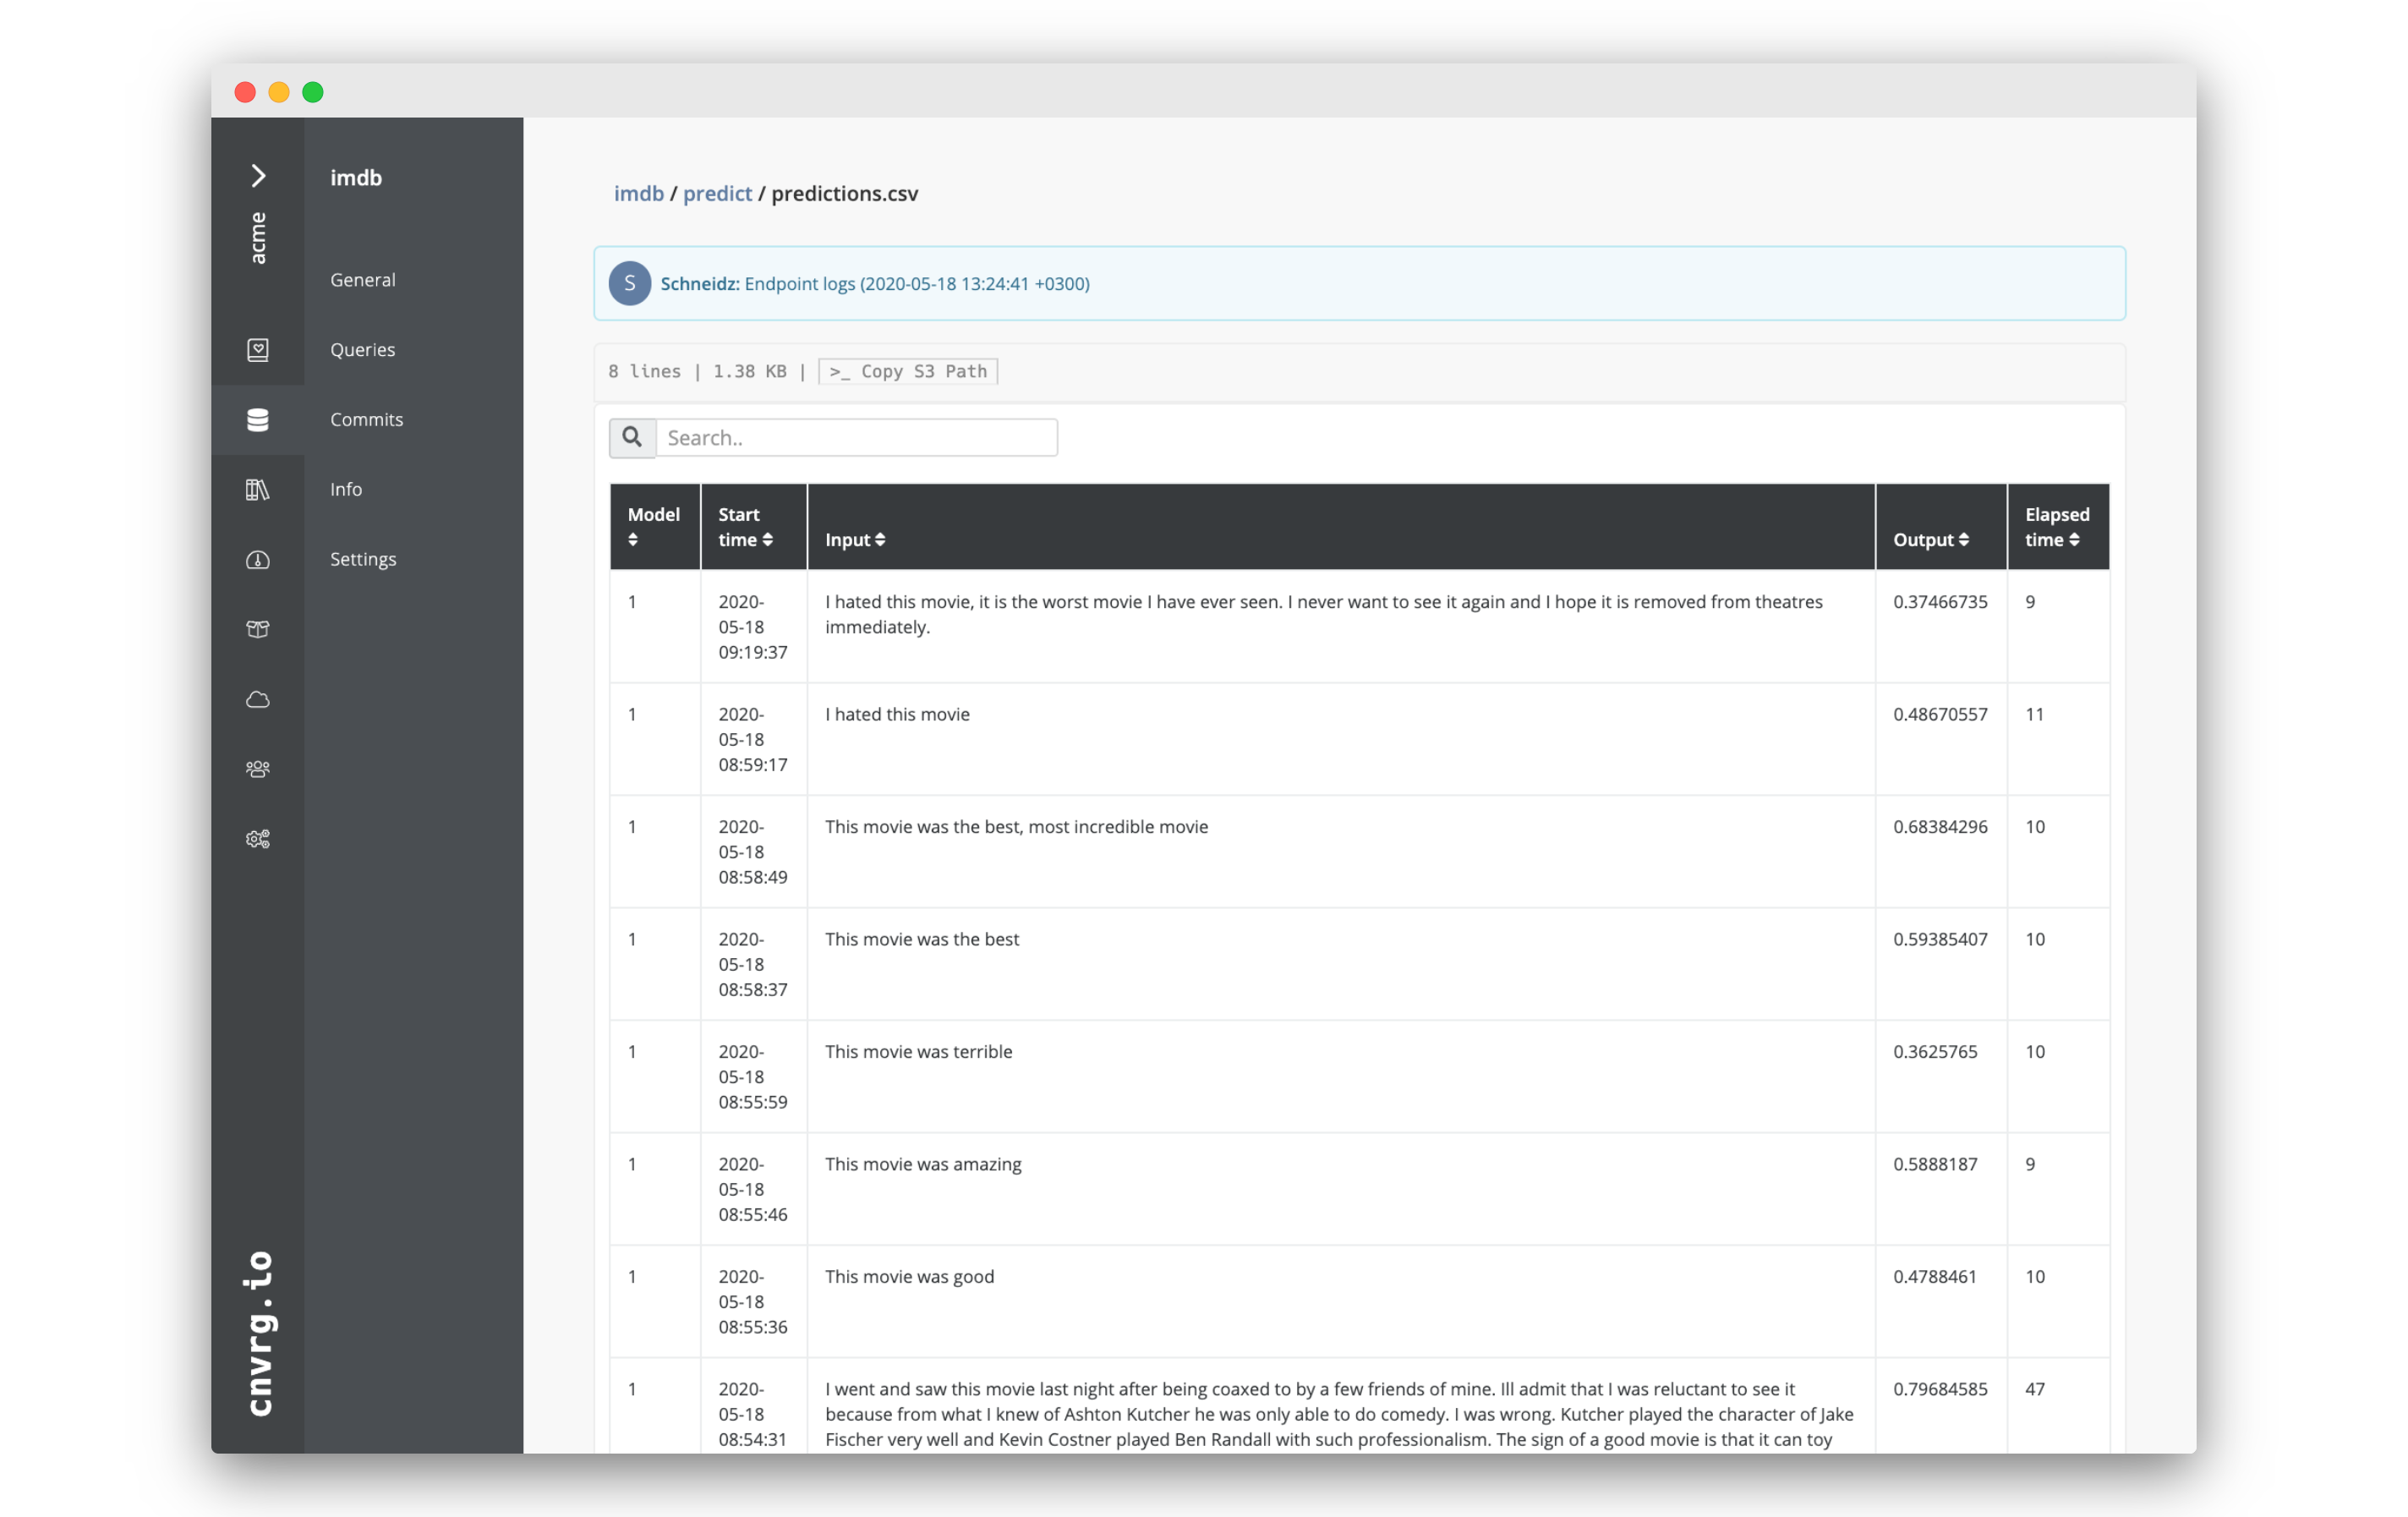
- Inside that folder, open Predictions.csv.
The CSV with all of the exported data should display.
# Conclusion
As you have seen, cnvrg serving is the best solution for your production needs. The collection of all these endpoint features, together with the power if cnvrg flows, allows truly limitless monitoring and automation.
Setting up a service to track one or more metrics and then retrain as needed automatically on the data from the endpoint is incredibly intuitive and is key to an effective AI workflow.