# Classifying Handwritten Digits from the MNIST Dataset
cnvrg is a full-stack data science platform. cnvrg empowers data science teams with a collaborative place for their entire data science and machine learning workflows – from research, development and experimentation to the actual deployment of the model in production. cnvrg makes data science work reproducible, accessible and faster.
In this guide we will be going through every step of a data science workflow using MNIST as an example. Some developers love running their workflow through a Command Line interface like Terminal, and thankfully, cnvrg supports this functionality so in this guide we will specifically leverage the provided cnvrg CLI to accomplish our tasks.
We will be specifically covering the following features of cnvrg:
- Creating a project with the cnvrg CLI
- Creating a dataset with the cnvrg CLI
- Running an experiment with the cnvrg CLI
- Running a grid search with the cnvrg CLI
- Publishing a model
- Conducting A/B testing on a live endpoint
NOTE
This tutorial is focussed on the cnvrg CLI. See the imdb tutorial for a tutorial focussing on the web UI.
# About MNIST
If you have been doing deep-learning in the past few years, you’re probably familiar with “MNIST” as it’s probably the “Hello World” project of deep learning. For those who aren’t familiar with the name, MNIST is a dataset of handwritten digits.
MNIST is one of the first use-cases where deep learning outperformed classic computer vision and machine learning efforts.
The problem is simple: train a computer to interpret handwritten numerals. For our example, we will use a Keras MNIST dataset and train a convolutional neural network to read the images and classify them as a number.
# cnvrg CLI
To begin, please make sure you have already installed and set up cnvrg CLI on your machine. To install the cnvrg CLI, please use the Download and Install cnvrg CLI guide. We also assume you have Git installed on your machine.
# Creating a Project and Linking it to a Local Directory
In your terminal, clone the Git repository with our files by running:
$ git clone https://github.com/cnvrg/mnist-tutorial.git
Go into the folder that was just created from the online repository by running:
$ cd mnist-tutorial
Now we can create a project on cnvrg based on this local directory by using the command:
$ cnvrg link --title="mnist-example"
Finally run:
$ cnvrg sync
to upload all our local directory's files to the online project. the previous step will have provided you with a link you can use to view the files using the Web interface. Feel free to navigate to it to see what we've just accomplished.
TIP
Whenever you change the files on your local machine, run the following command to update the online system:
$ cnvrg sync
# Create a Dataset
In the terminal, move out of the Project's directory by running the command:
$ cd ..
Now we will make a new local directory to use to store our dataset files. To do so, run the command:
$ mkdir mnist_dataset
Go in to the new directory by running:
$ cd mnist_dataset
We will now tell cnvrg that this folder is a dataset by using the command:
$ cnvrg data init
Great, let's add some data to our dataset! Download the data using:
$ curl -OL https://github.com/cnvrg/mnist_with_dataset/raw/master/mnist.npz
Finally, just like we did with the project, we will upload our local files to the online dataset using:
$ cnvrg data put mnist_dataset *
# Running an Experiment
In this example, we've provided you with a ready-made training Python file, so let's use it to run an experiment and train a model. First navigate back into the Project's directory.
TIP
If you're still in the Dataset directory, run the command:
$ cd .. && cd mnist-tutorial
The CLI allows you to easily run cnvrg experiments directly from the command line.
- To run
mnist.pyon the default compute (medium CPU) run:
$ cnvrg run --data="mnist_dataset" python3 mnist.py
- To run
mnist.pyon a GPU machine, run:
cnvrg run --gpuxl --data="mnist_dataset" python3 mnist.py
The CLI will send you a direct link to the now running experiment so that you can track its progress live from the Web interface. In the background, cnvrg has done all of the work (connecting to the machine, loading the docker image, cloning the dataset and project files and running the code) for you.
# Running a Grid Search
A Grid Search is a really simple way to do hyperparameter tuning and in cnvrg it enables you to run multiple experiments with different parameters in a single command. To run a grid search command, you'll need to provide a yaml that defines the parameters for the run.
Below you can see an example yaml file:
#This is an example yaml file for mnist project
parameters:
# Integer parameter is a range of possible values between a minimum (inclusive)
# and maximum (not inclusive) values. Values are floored (0.7 => 0)
- param_name: "epochs"
  type: "integer"
  min: 2 # inclusive
  max: 15 # not inclusive
  scale: "linear"
  steps: 5 # The number of linear steps to produce.

# Categorical parameter is an array of string values
- param_name: "batch_size"
  type: "categorical"
  values: ["128", "256", "512"]
In your favorite code editor, IDE or terminal text-editor, create a new file and with the above code and save it as grid.yaml in your projects' local directory.
Now that we have a yaml file saved in the project, we can simply run:
cnvrg run --grid=grid.yaml python3 mnist.py
and cnvrg will create and run experiments using all the different combinations of parameters indicated by the yaml provided. You can follow the status of the experiments using the Web interface by going to the Experiments tab for the corresponding project.
# Visualizing and Comparing
# Via the Web
After all of our experiments have successfully run, we can now compare and choose the best performing model. cnvrg makes this really easy with our built-in vizualisation and comparison tools. Unfortunately, these are just too beautiful for the command line, so to make use of them you'll have to use the Web interface.
Navigate online to the Experiments page and select all the experiments we just ran as part of the grid search. At the top, click Actions and then select Compare in the drop-down menu.
Here we can see all the results and metrics of our experiments beautifully displayed together. It makes it easier to choose our most accurate model.
Once we’ve identified our favorite, we can put it into deployment!
# Deploying a Model
Let’s deploy the model as a REST API. There’s no need to contact IT or DevOps – all you need to do is perform the following steps:
Navigate to the Serving tab in your project.
Click Publish.
The New Endpoint pane appears:
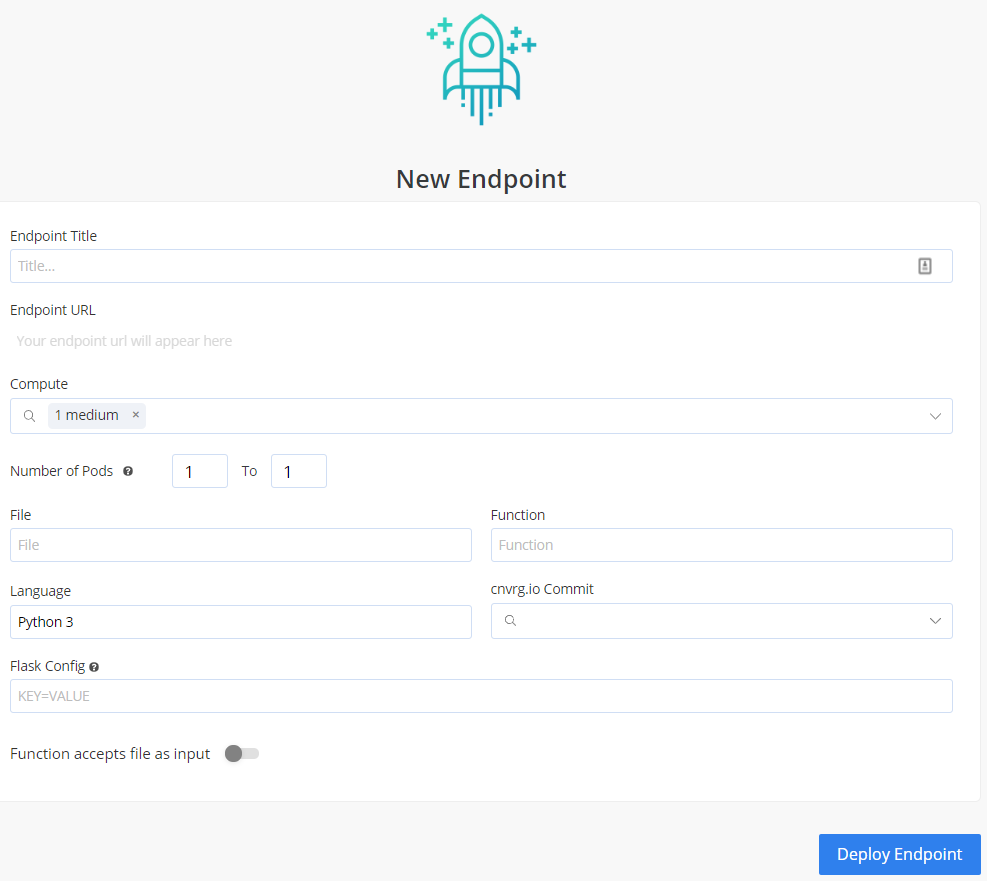
Provide details for the following fields:
- Title
- Compute. Leave unchanged.
- File. In this case, select
predict.py. - Function. In this case, specify:
predict. - Commit. Make sure to choose the commit made by our previous successful experiment!
- Make sure Function accepts file as input is enabled so that we can send images to the endpoint.
Click Deploy Endpoint.
cnvrg takes your project (dependencies, code) and wraps it with a thin and scalable REST API. It will import your specified function from the specified file, expose a URL and monitor its activity. Now, the secured URL can be used by your customer and can be embedded in an application or dashboard.
# Querying the Model
Congratulations, your endpoint is live. Let's use it. Your endpoint can be added to applications or reached directly from any machine (of course you need the password or token, so it is entirely secure).
For this example, we'll demonstrate reaching the live endpoint from within a functioning Python program and sending it some MNIST images for classification.
On your now live endpoint's page, towards the bottom, you'll see pre-generated code for accessing the endpoint. We've automatically generated the code for both terminal access and embedding in Python programs. In this case, make sure you have selected Python. There you'll see a basic example of Python code for accessing the endpoint.
You could play around with it yourself, but alternatively you can create a new file called cnvrg-endpoint.py and paste in the following code. Make sure to change the specified parts of the code to match your newly created endpoint!
import http.client
import base64
import re

user_file = input("Enter the name of your hand-drawn number: ")

conn = http.client.HTTPSConnection("replace-with-your-link.gcp.cnvrg.io")

with open(user_file, "rb") as image_file:
    encoded_string = base64.b64encode(image_file.read()).decode("utf-8")

payload = "{\"data\": \"" + encoded_string +"\"}"

headers = {
    'Cnvrg-Api-Key': "replace-with-your-key",
    'Content-Type': "application/json"
    }

conn.request("POST", "/api/v1/endpoints/replace-with-your-slug", payload, headers)

res = conn.getresponse()
data = res.read()

prediction = re.search(r'\d+', data.decode("utf-8"))
print("The endpoint predicts the hand-drawn number is: " + prediction.group())
This is a very basic Python program which prompts the user for the name of a file, send it to the endpoint, and prints to the screen the endpoint's prediction.
Let's give it a go. Navigate back to Experiments and then select the most accurate model you produced. Go into the dashboard for the experiment.
At the top right, select Menu and then in the drop-down menu, select Deploy.
Right click and save these 3 images in the same directory as your new Python file:


Now run:
$ python3 cnvrg-endpoint.py
The program will prompt you to enter the name of your file.
Type mnist1.png or mnist2.png or mnist3.png
Bam! The program should tell you what number is in the picture, so: The endpoint predicts your number is:
This is just a simple use of the REST API, but you can extend it in any way throughout your systems and applications.
# Monitoring Models
Beyond deploying the model into production, cnvrg also provides powerful tools that allow you to monitor the status of your endpoint.
Let's have a look at our endpoint using these tools.
TIP
You'll see more useful information if you have used your model a few times. Maybe run a few more predictions before continuing.
Charts
The first thing you will see on your endpoints page in the Charts tab is a live overview of all traffic into the endpoint. This is a great way to quickly see the usage of your endpoint.
Logs
You can also switch over to Logs and see exactly what inputs are being sent and what was output by your endpoint.
Graphana
cnvrg has native integration with Graphana which is a really handy tool for monitoring you compute's resources. Click over to the Dashboard tab. Now you'll see a few metrics about the load of your pds. If you select Pods on the top left and then navigate to Nodes, you'll see deep metrics about the status of your compute.
Kibana
If you'd like to see all the granular logs for the pods in your endpoint, click over to Pods Logs and you will be presented with a integrated Kibana dashboard featuring incredible depth of information about the activities of your compute.
Updating Models
cnvrg understands the machine learning is an iterative process. A model must be continually refined, retrained on new data and updated to ensure accuracy. To make this as simple as possible, cnvrg supports seamless model updating.
Navigate to the final tab of your endpoint Configurations. Click New Version on the panel that loads. Under Model B you can chose a new commit based on an experiment that produced a more accurate model and simply click Update and cnvrg updates the endpoint so that it now leverages the updated model.
This way, your end-users, applications or any code leveraging the endpoint won't see any changes or require any updates and will simply start using the updated model immediately.
TIP
You can use the Validation options in the new model to conduct simple A/B testing to decide which model to ultimately use
# Conclusion
As you can see in this example, cnvrg truly is a full-stack data science solution with all the tools to operate the entire machine learning workflow.
Make sure to check out some of our other tutorials to learn more about cnvrg using different use cases.