# Experiment Visualization in R
cnvrg has full support for R throughout the entire ML life cycle. Any R code can be run with a compatible R image, and you can create custom experiment visualizations.
This tutorial will demonstrate example code for tracking and visualizing your R experiments.
# Create a New Project
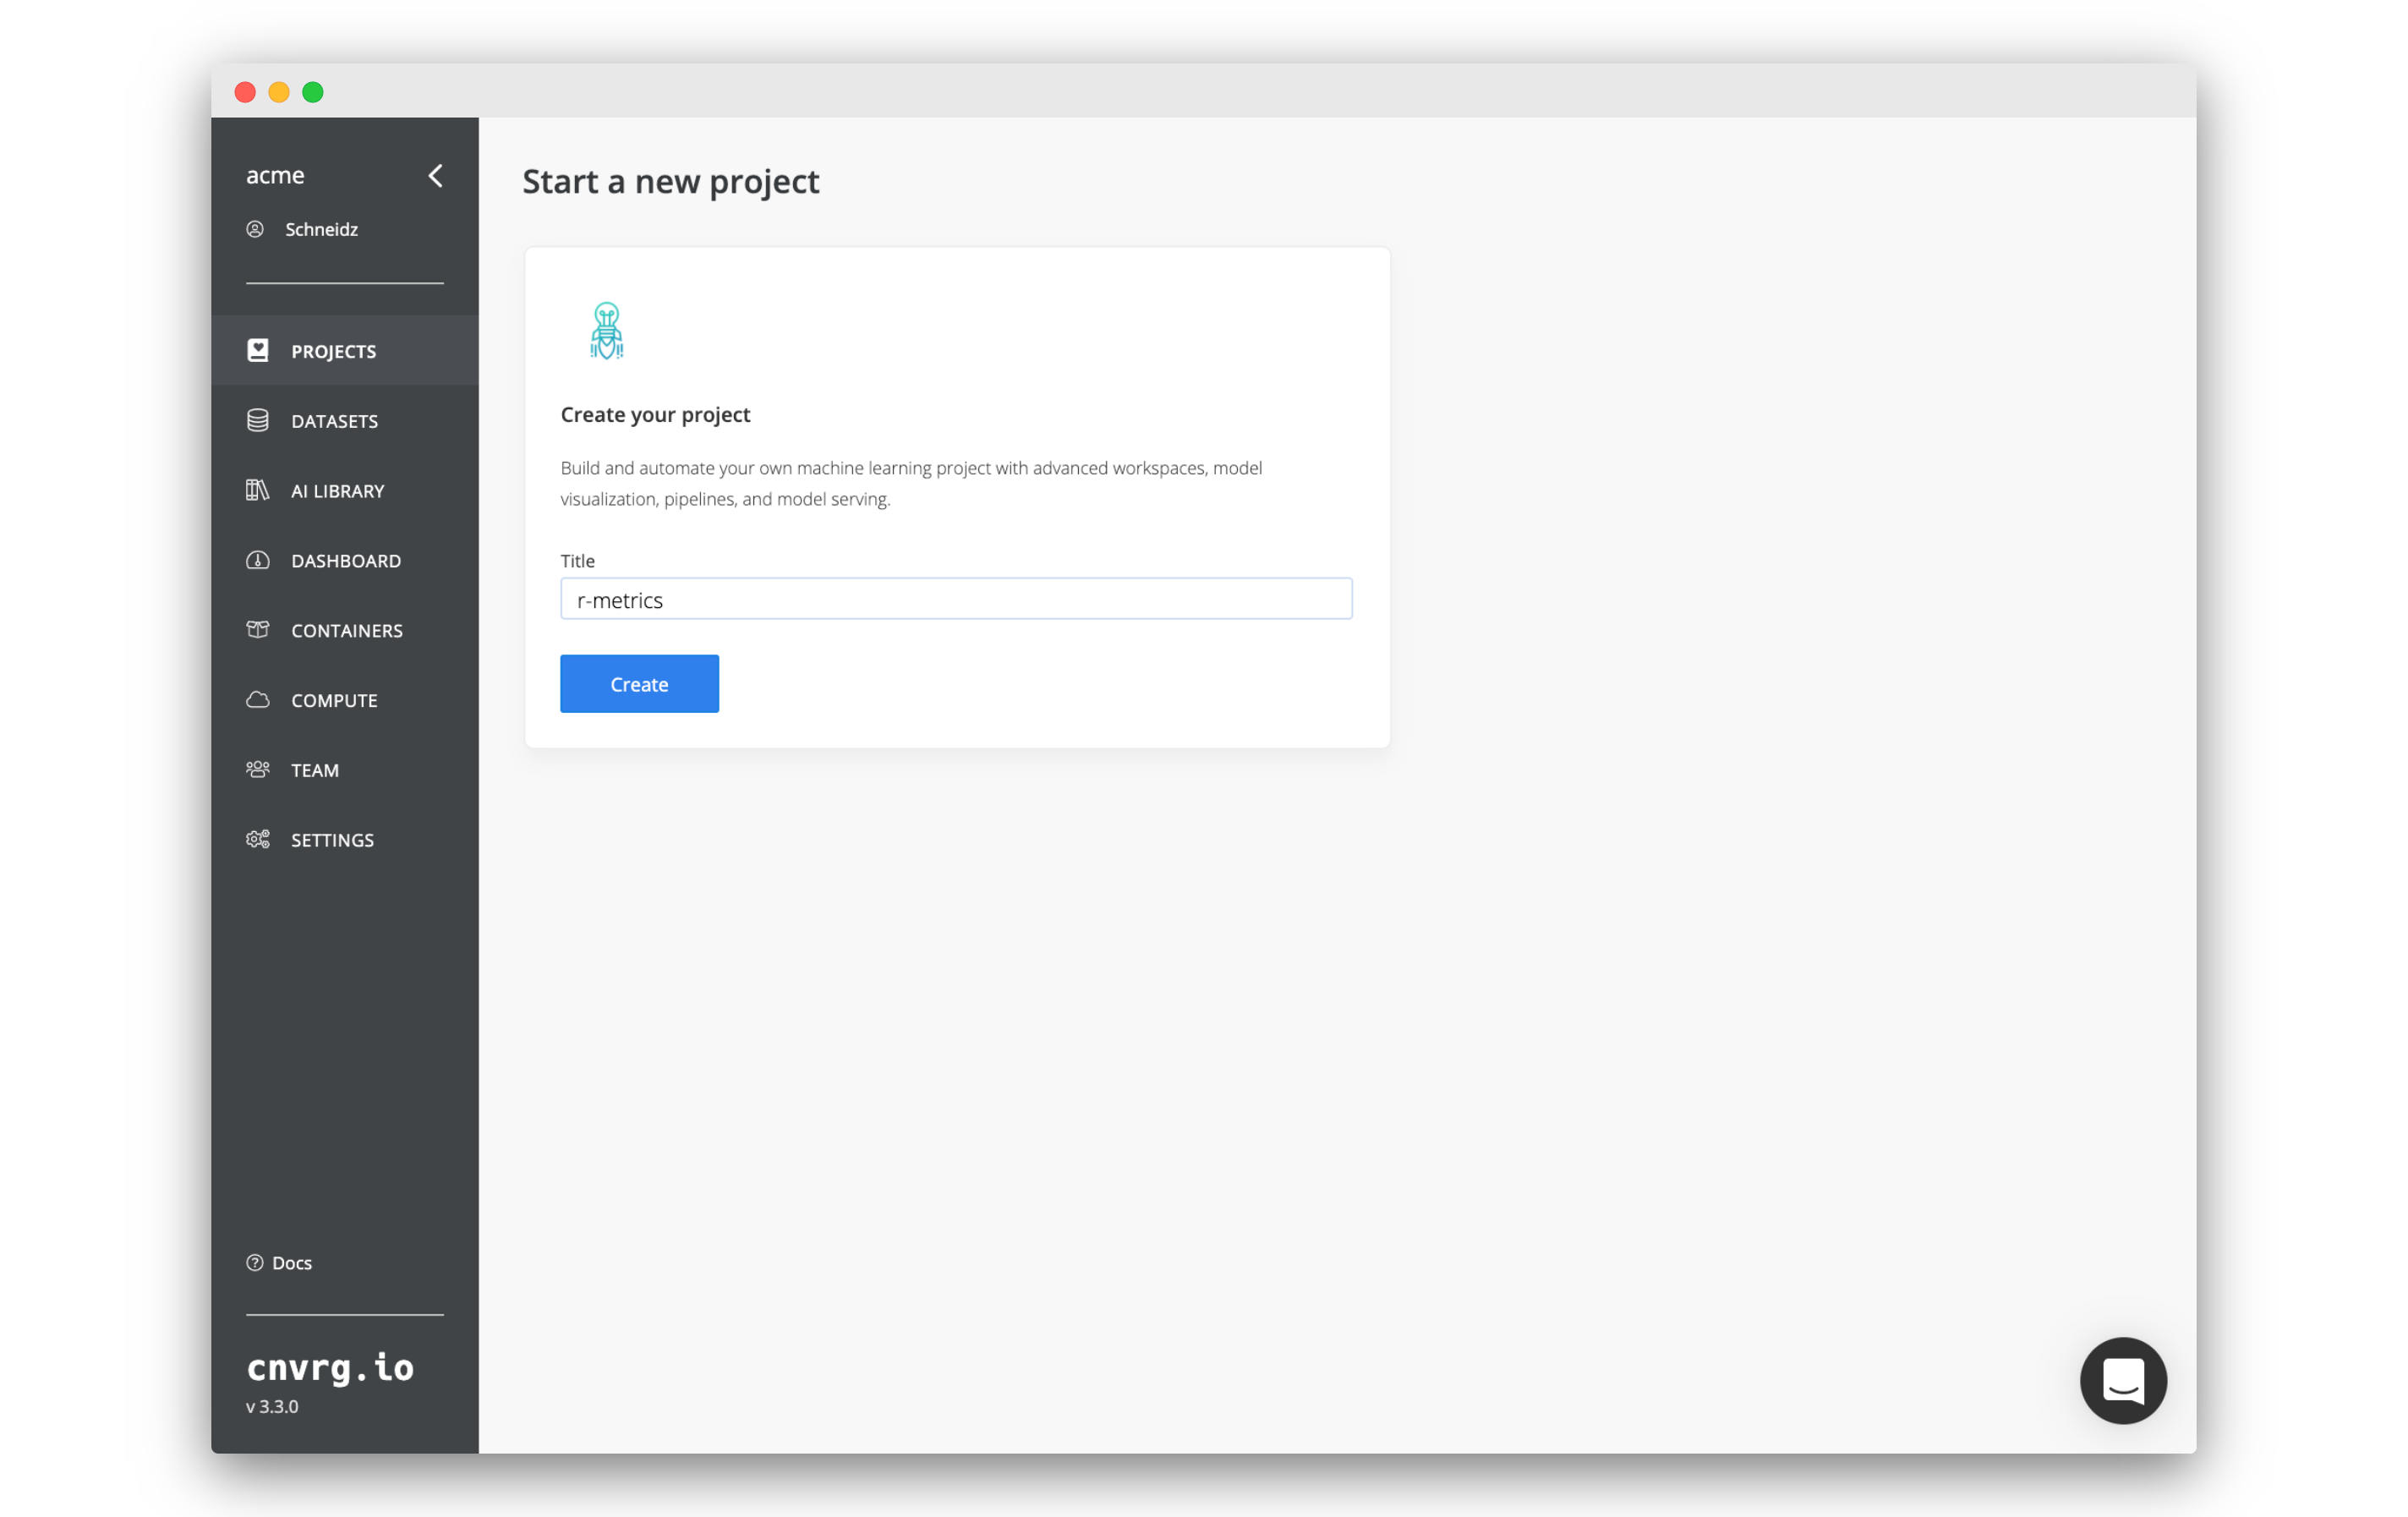
- Go to Projects and click Start Project.
- Name the project
r-metrics.
# Add the Experiment Code
First, we will be adding the example code which will be used to create the experiment metrics. You can of course use the workspaces feature to spin up an R Studio workspace where you could build your own code and run quick experiments. However, we will simply be using pre-prepared code.
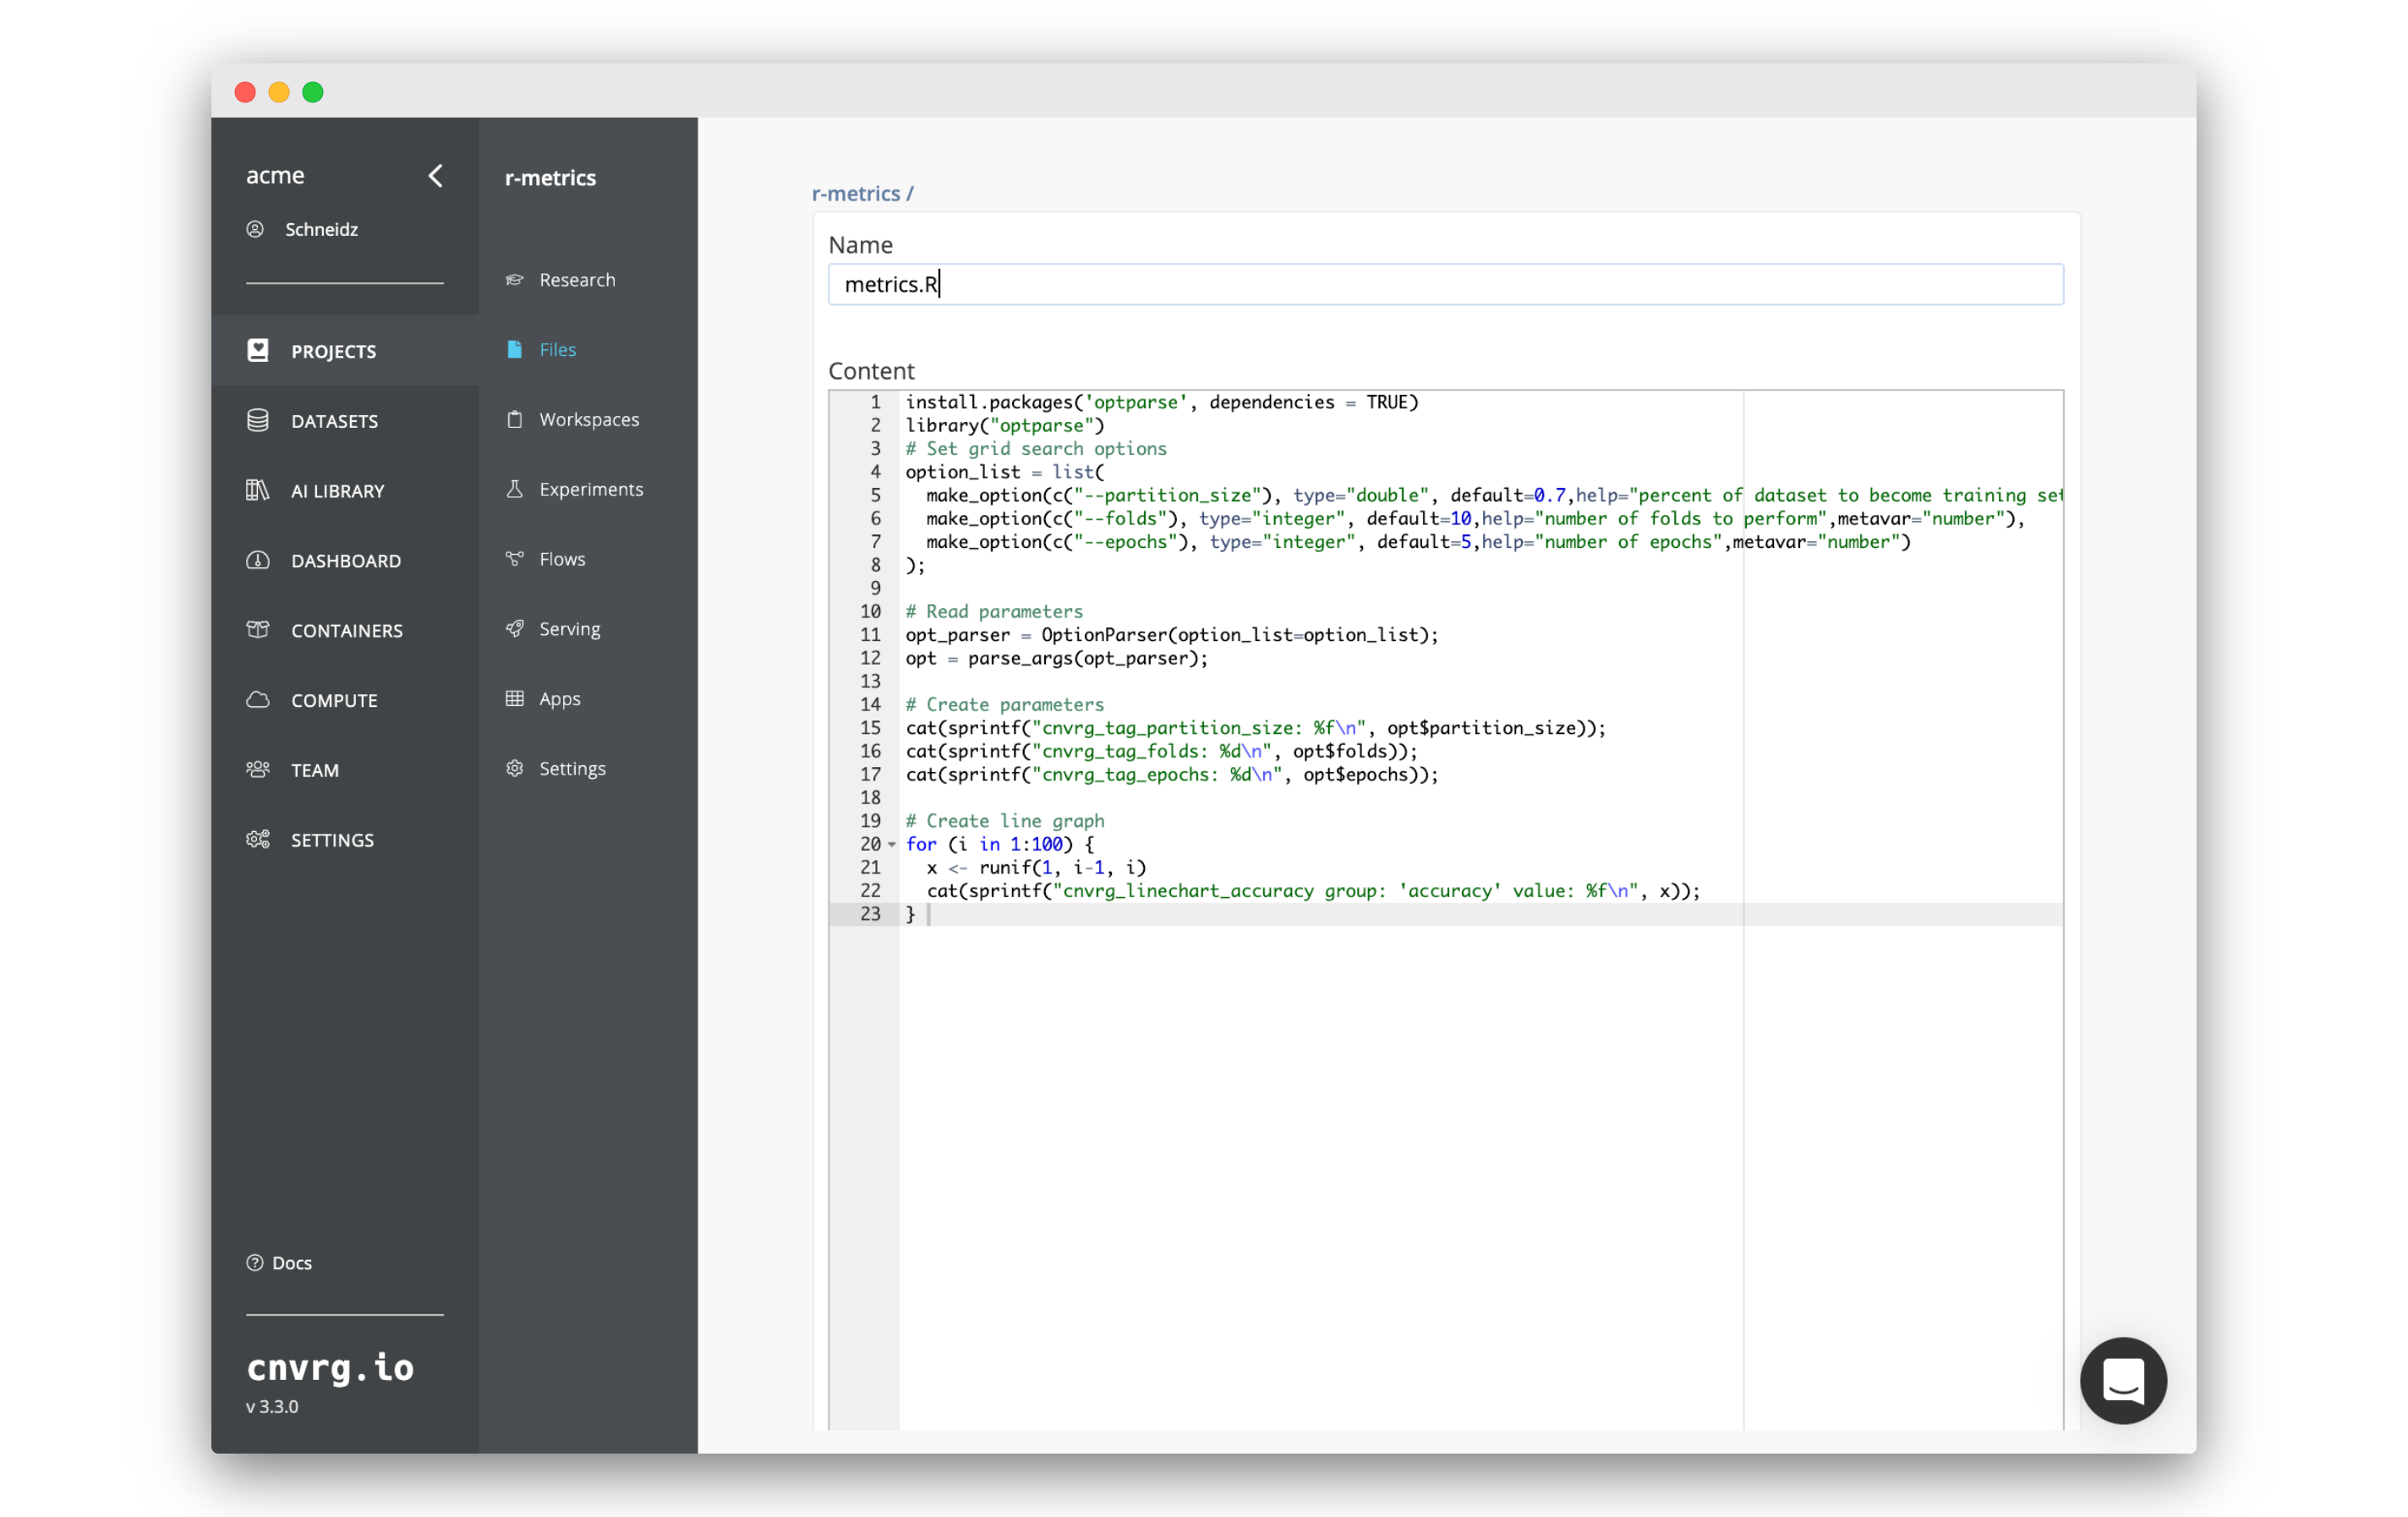
- Go to Files inside your
r-metricsproject. - Click New File.
- Copy and paste the following code into the code editor:
install.packages('optparse', dependencies = TRUE) library("optparse") # Set grid search options option_list = list( make_option(c("--partition_size"), type="double", default=0.7,help="percent of dataset to become training set",metavar="number"), make_option(c("--folds"), type="integer", default=10,help="number of folds to perform",metavar="number"), make_option(c("--epochs"), type="integer", default=5,help="number of epochs",metavar="number") ); # Read parameters opt_parser = OptionParser(option_list=option_list); opt = parse_args(opt_parser); # Create parameters cat(sprintf("cnvrg_tag_partition_size: %f\n", opt$partition_size)); cat(sprintf("cnvrg_tag_folds: %d\n", opt$folds)); cat(sprintf("cnvrg_tag_epochs: %d\n", opt$epochs)); # Create line graph for (i in 1:100) { x <- runif(1, i-1, i) cat(sprintf("cnvrg_linechart_accuracy group: 'accuracy' value: %f\n", x)); } - Name the file:
metrics.R - Click Submit to save the file.
There are some things to notice in the above code:
- We are using
optparseto parse the arguments on the command line. This enables us to support the grid searching feature in cnvrg. - We are logging parameters using the Research Assistant by printing to standard output with the following format:
"cnvrg_tag_key: value". - We are generating a graph by printing to standard output with the following format:
"cnvrg_linechart_Name group: "Group_name" value: Value".
# Run the Code in a Grid Search
Now that we have code ready, we can run some experiments.
- Go to Experiments in the project.
- Click New Experiment.
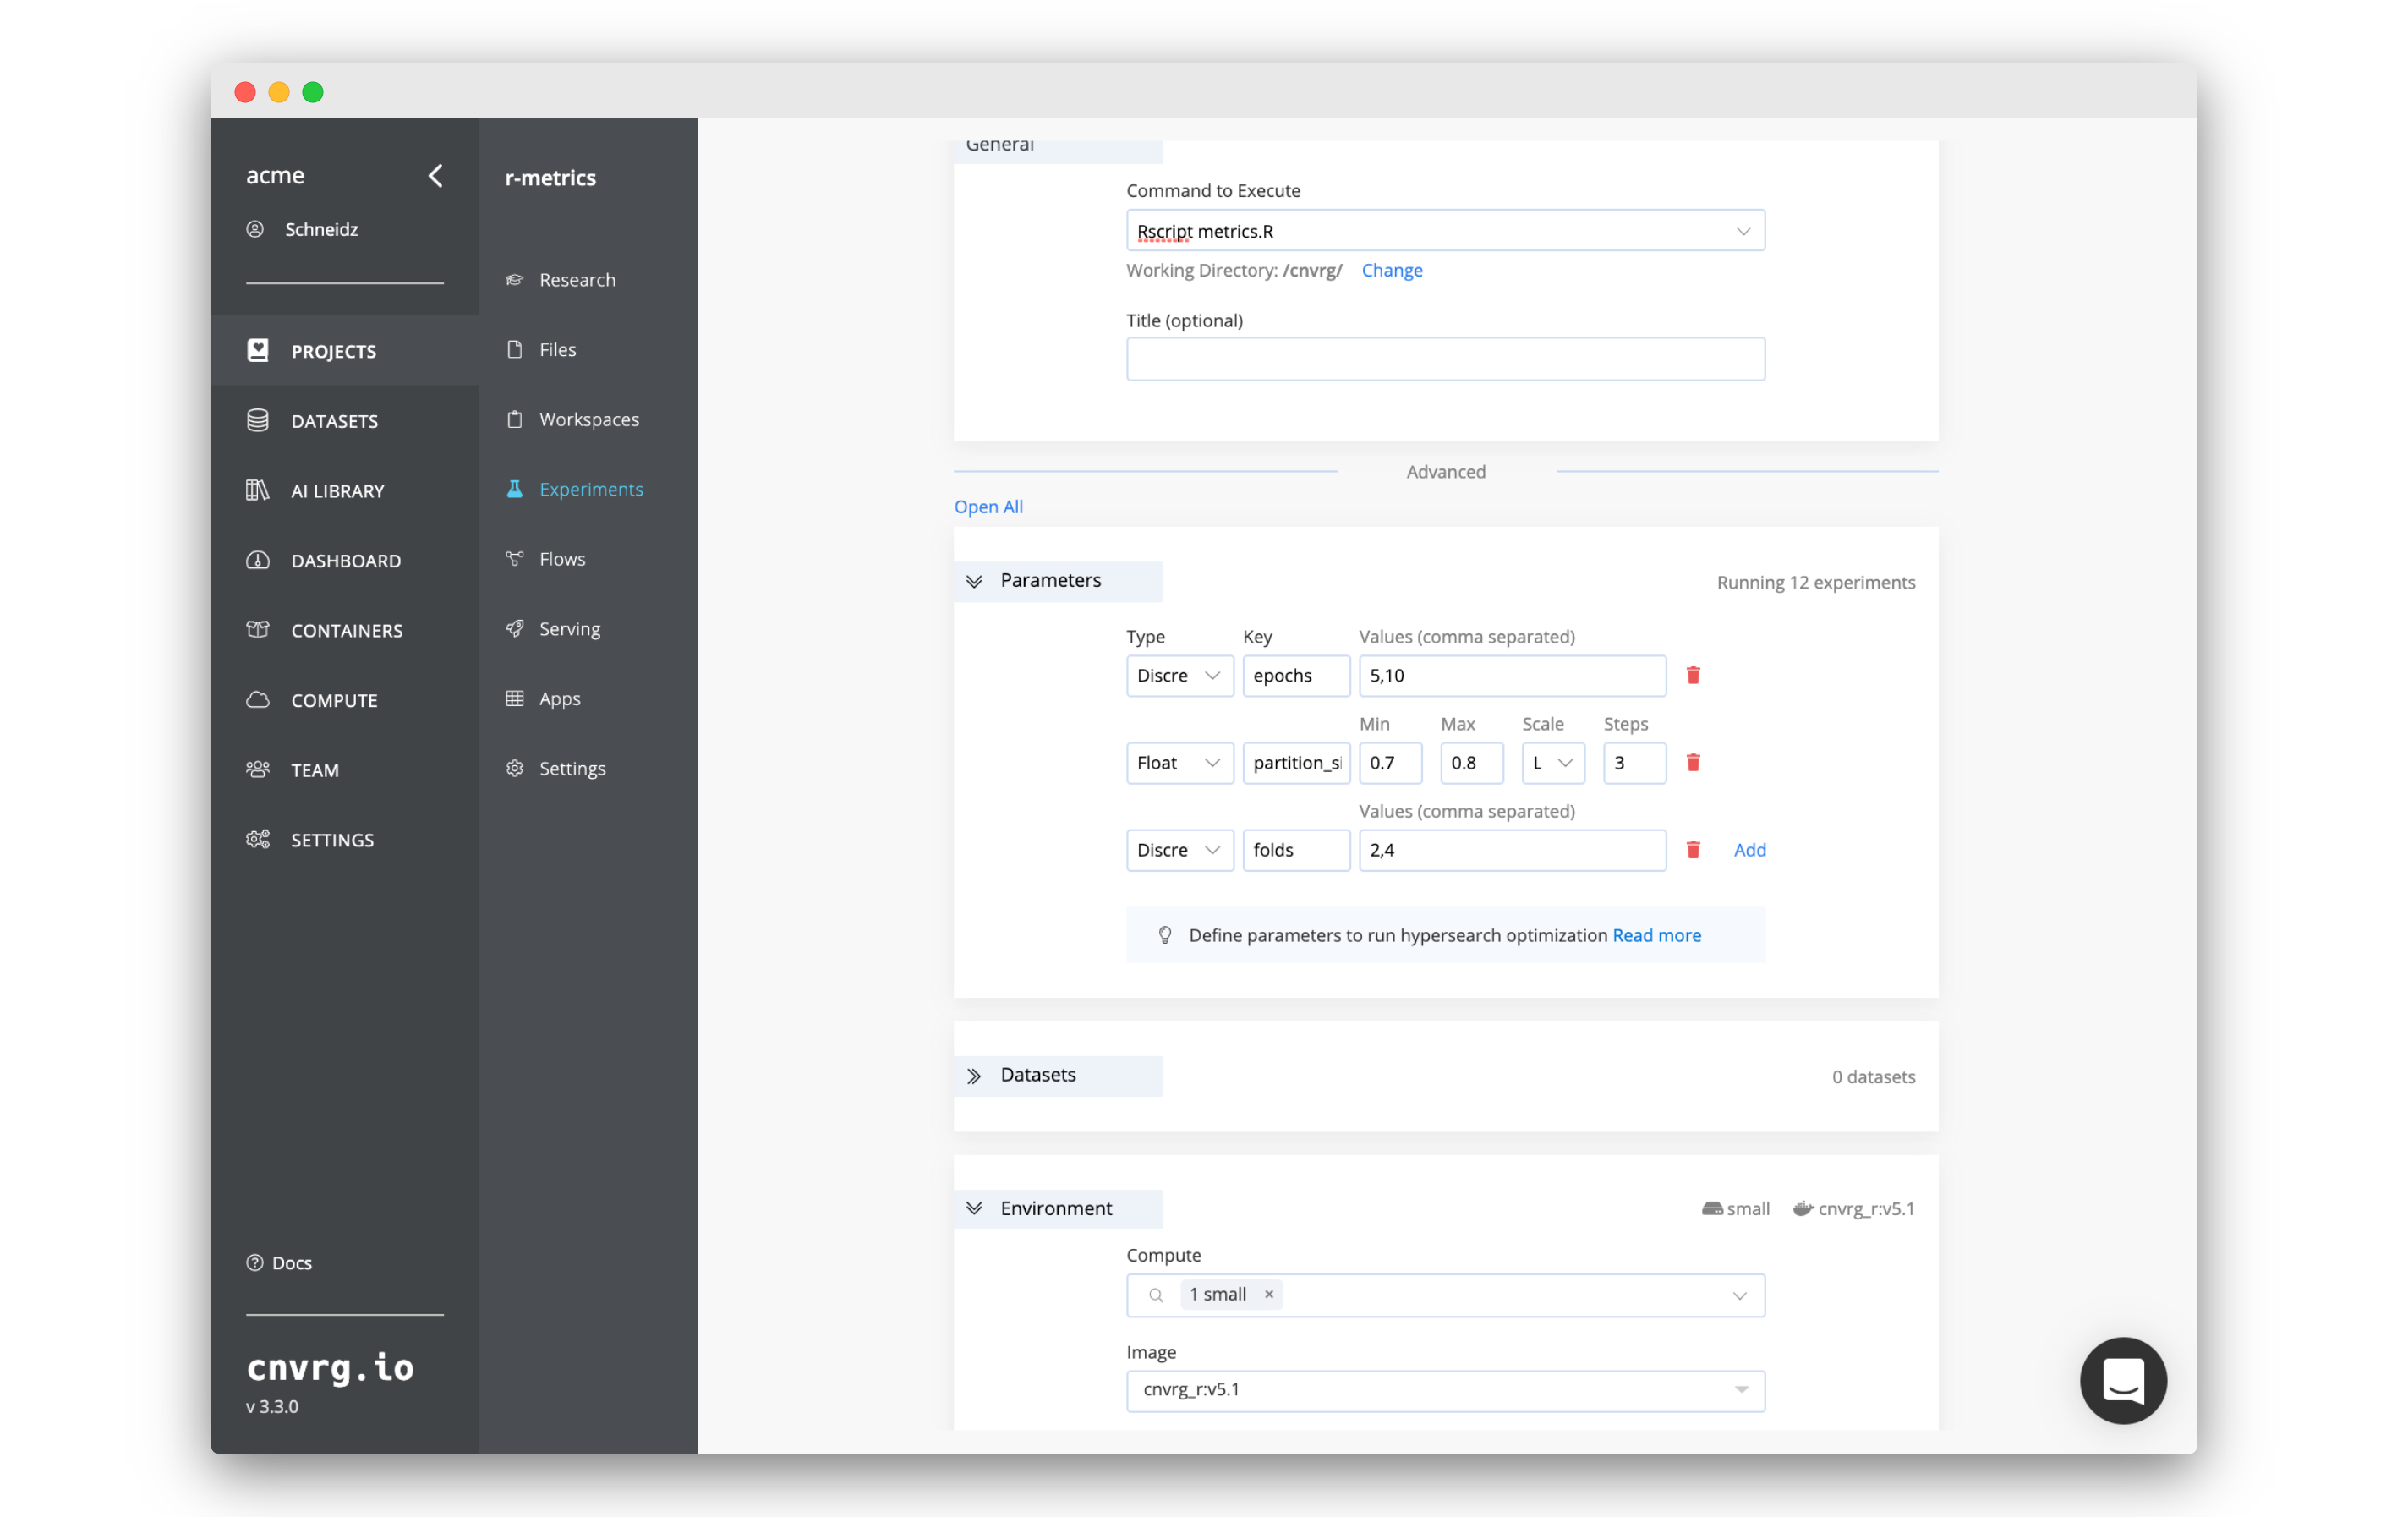
- Enter the Command to Execute as
Rscript metrics.R. - Click Parameters to expand the sub-heading, click Add twice and enter the following information. Click :
- Epochs:
- Type: Discrete
- Key:
epochs - Values:
5,10
- Partition Size:
- Type: Float
- Key:
partition_size - Min:
0.7 - Max:
0.8 - Scale: Linear
- Steps:
3
- Folds:
- Type: Discrete
- Key:
folds - Values:
2,4
- Epochs:
- Click Environment to expand the sub-heading and enter the following information:
- Compute: any compute of your choice.
- Image: A compatible R image. For example the latest
cnvrg_rimage.
- Click Run and confirm the action.
cnvrg will now spin up all the experiments in parallel on the compute you chose. 12 experiments in total will be spun up. cnvrg will do all of the MLOps and start running the code on the compute and image you selected.
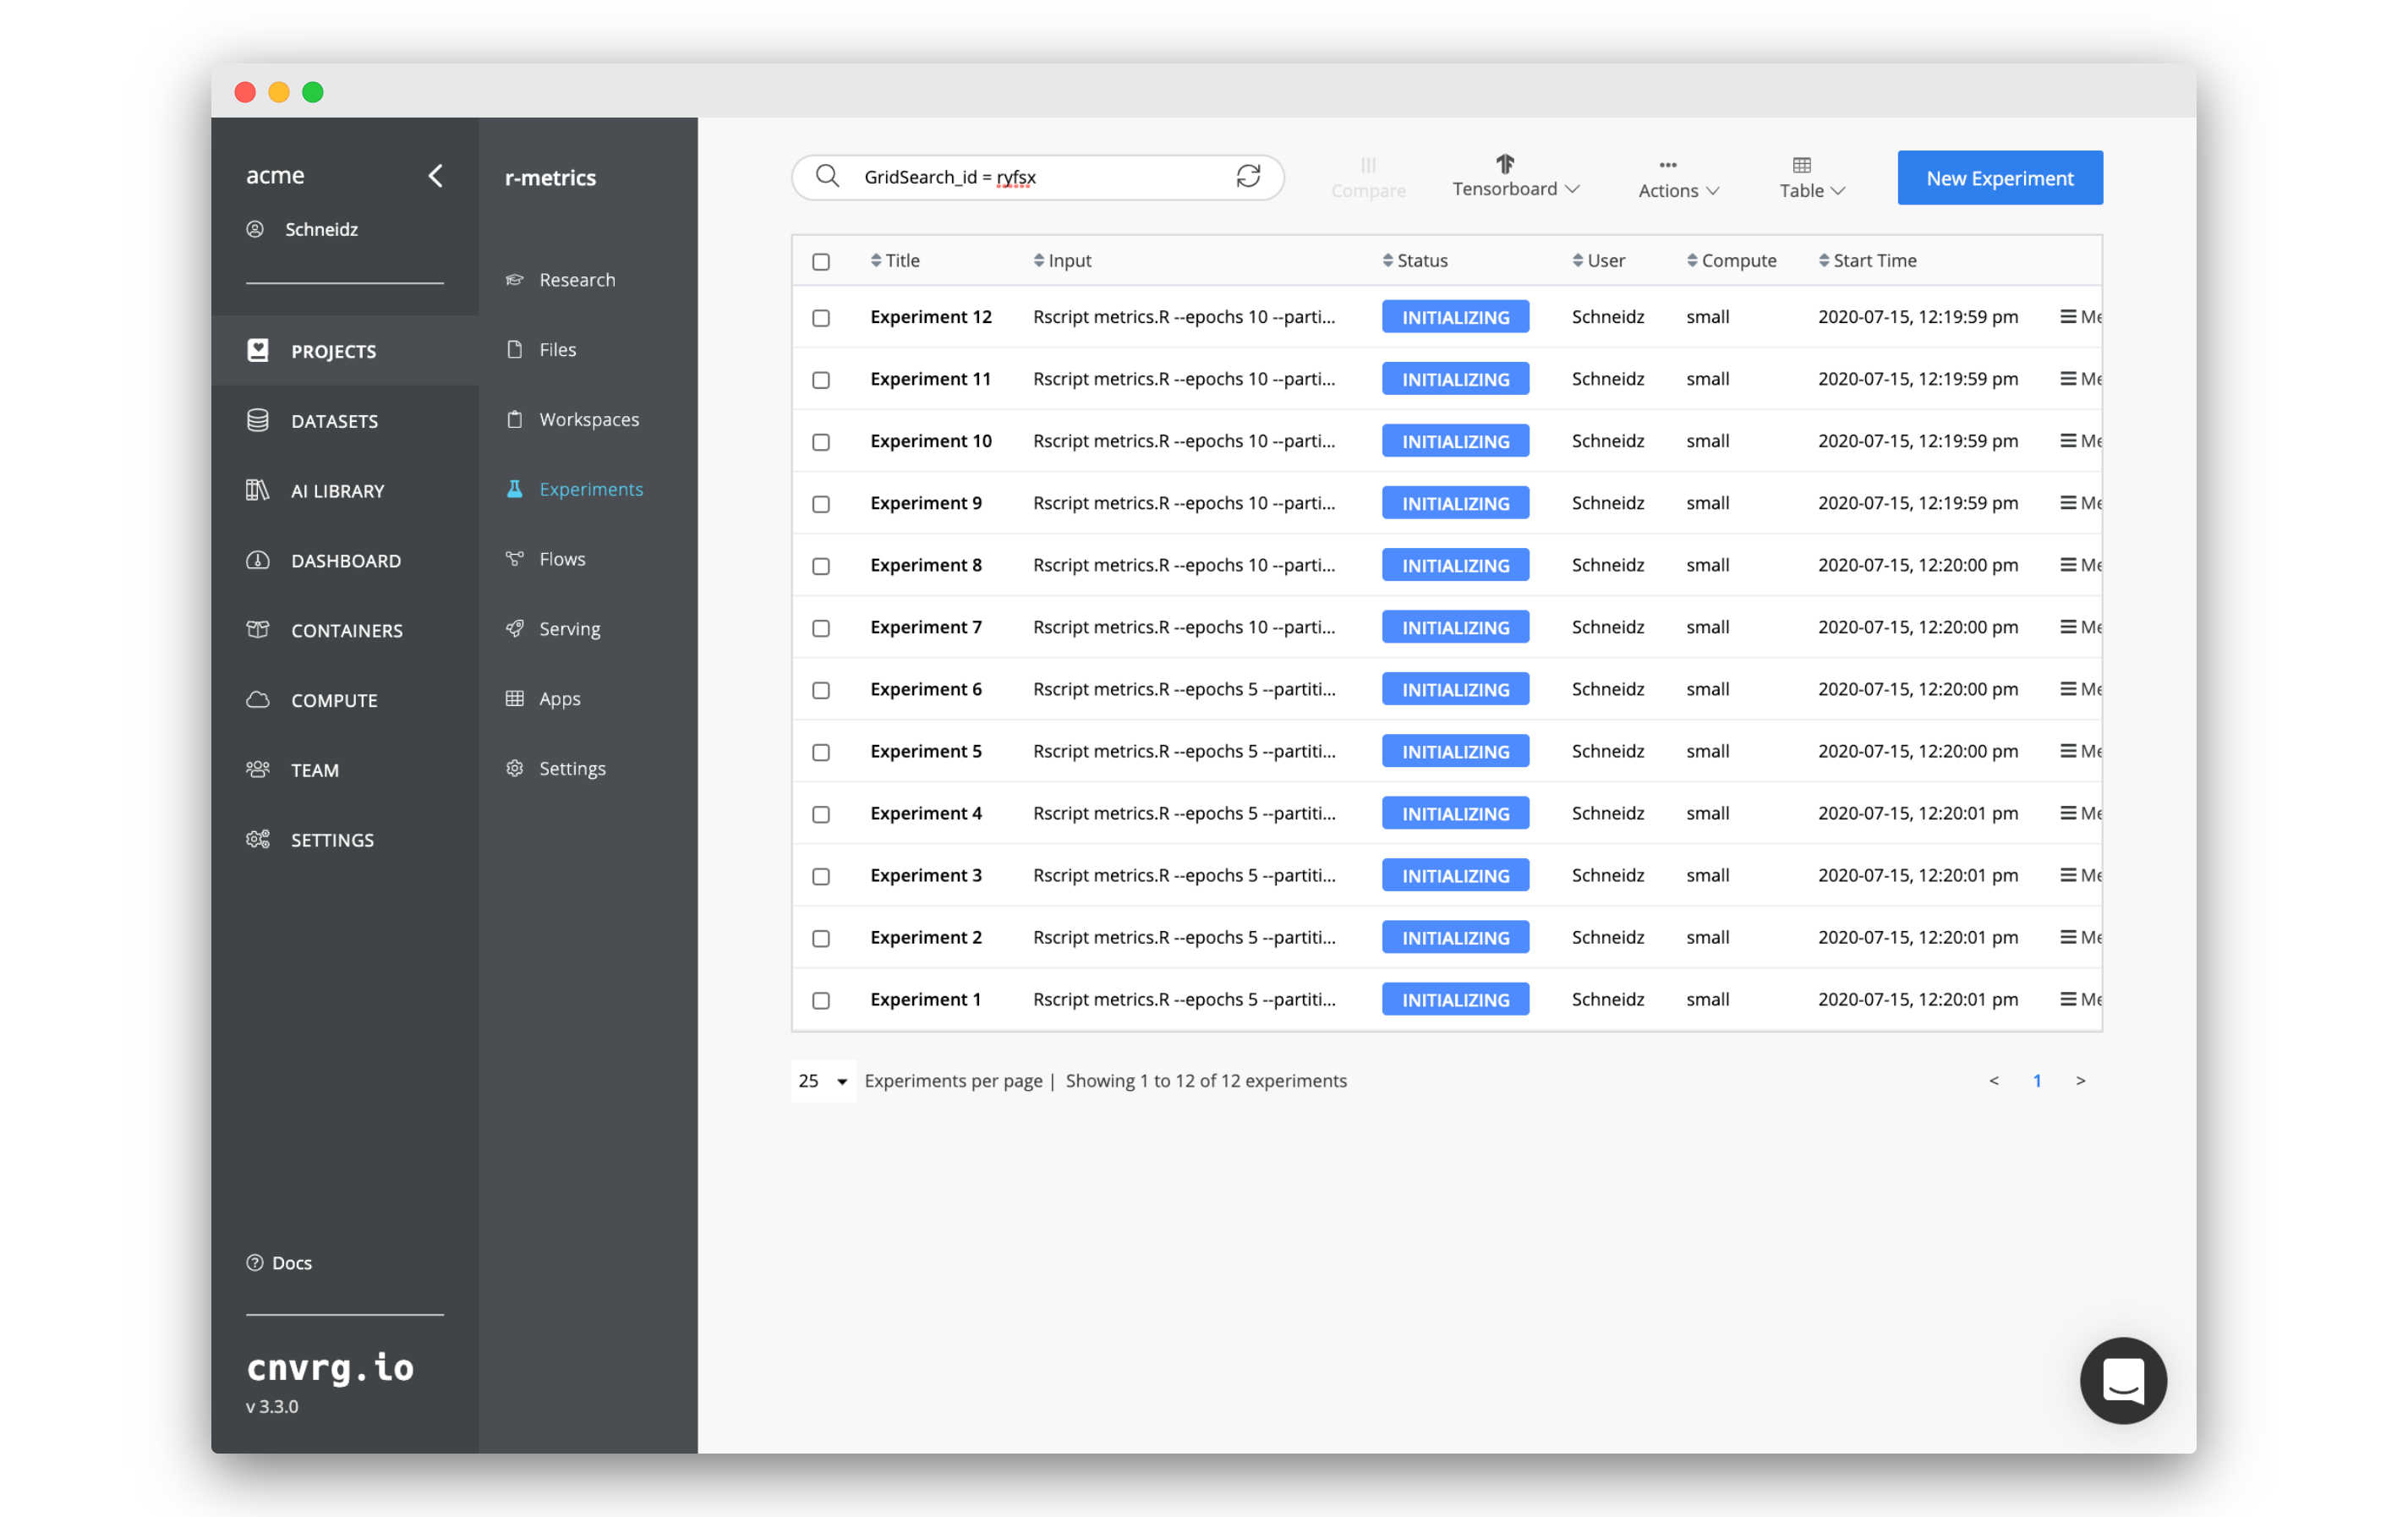
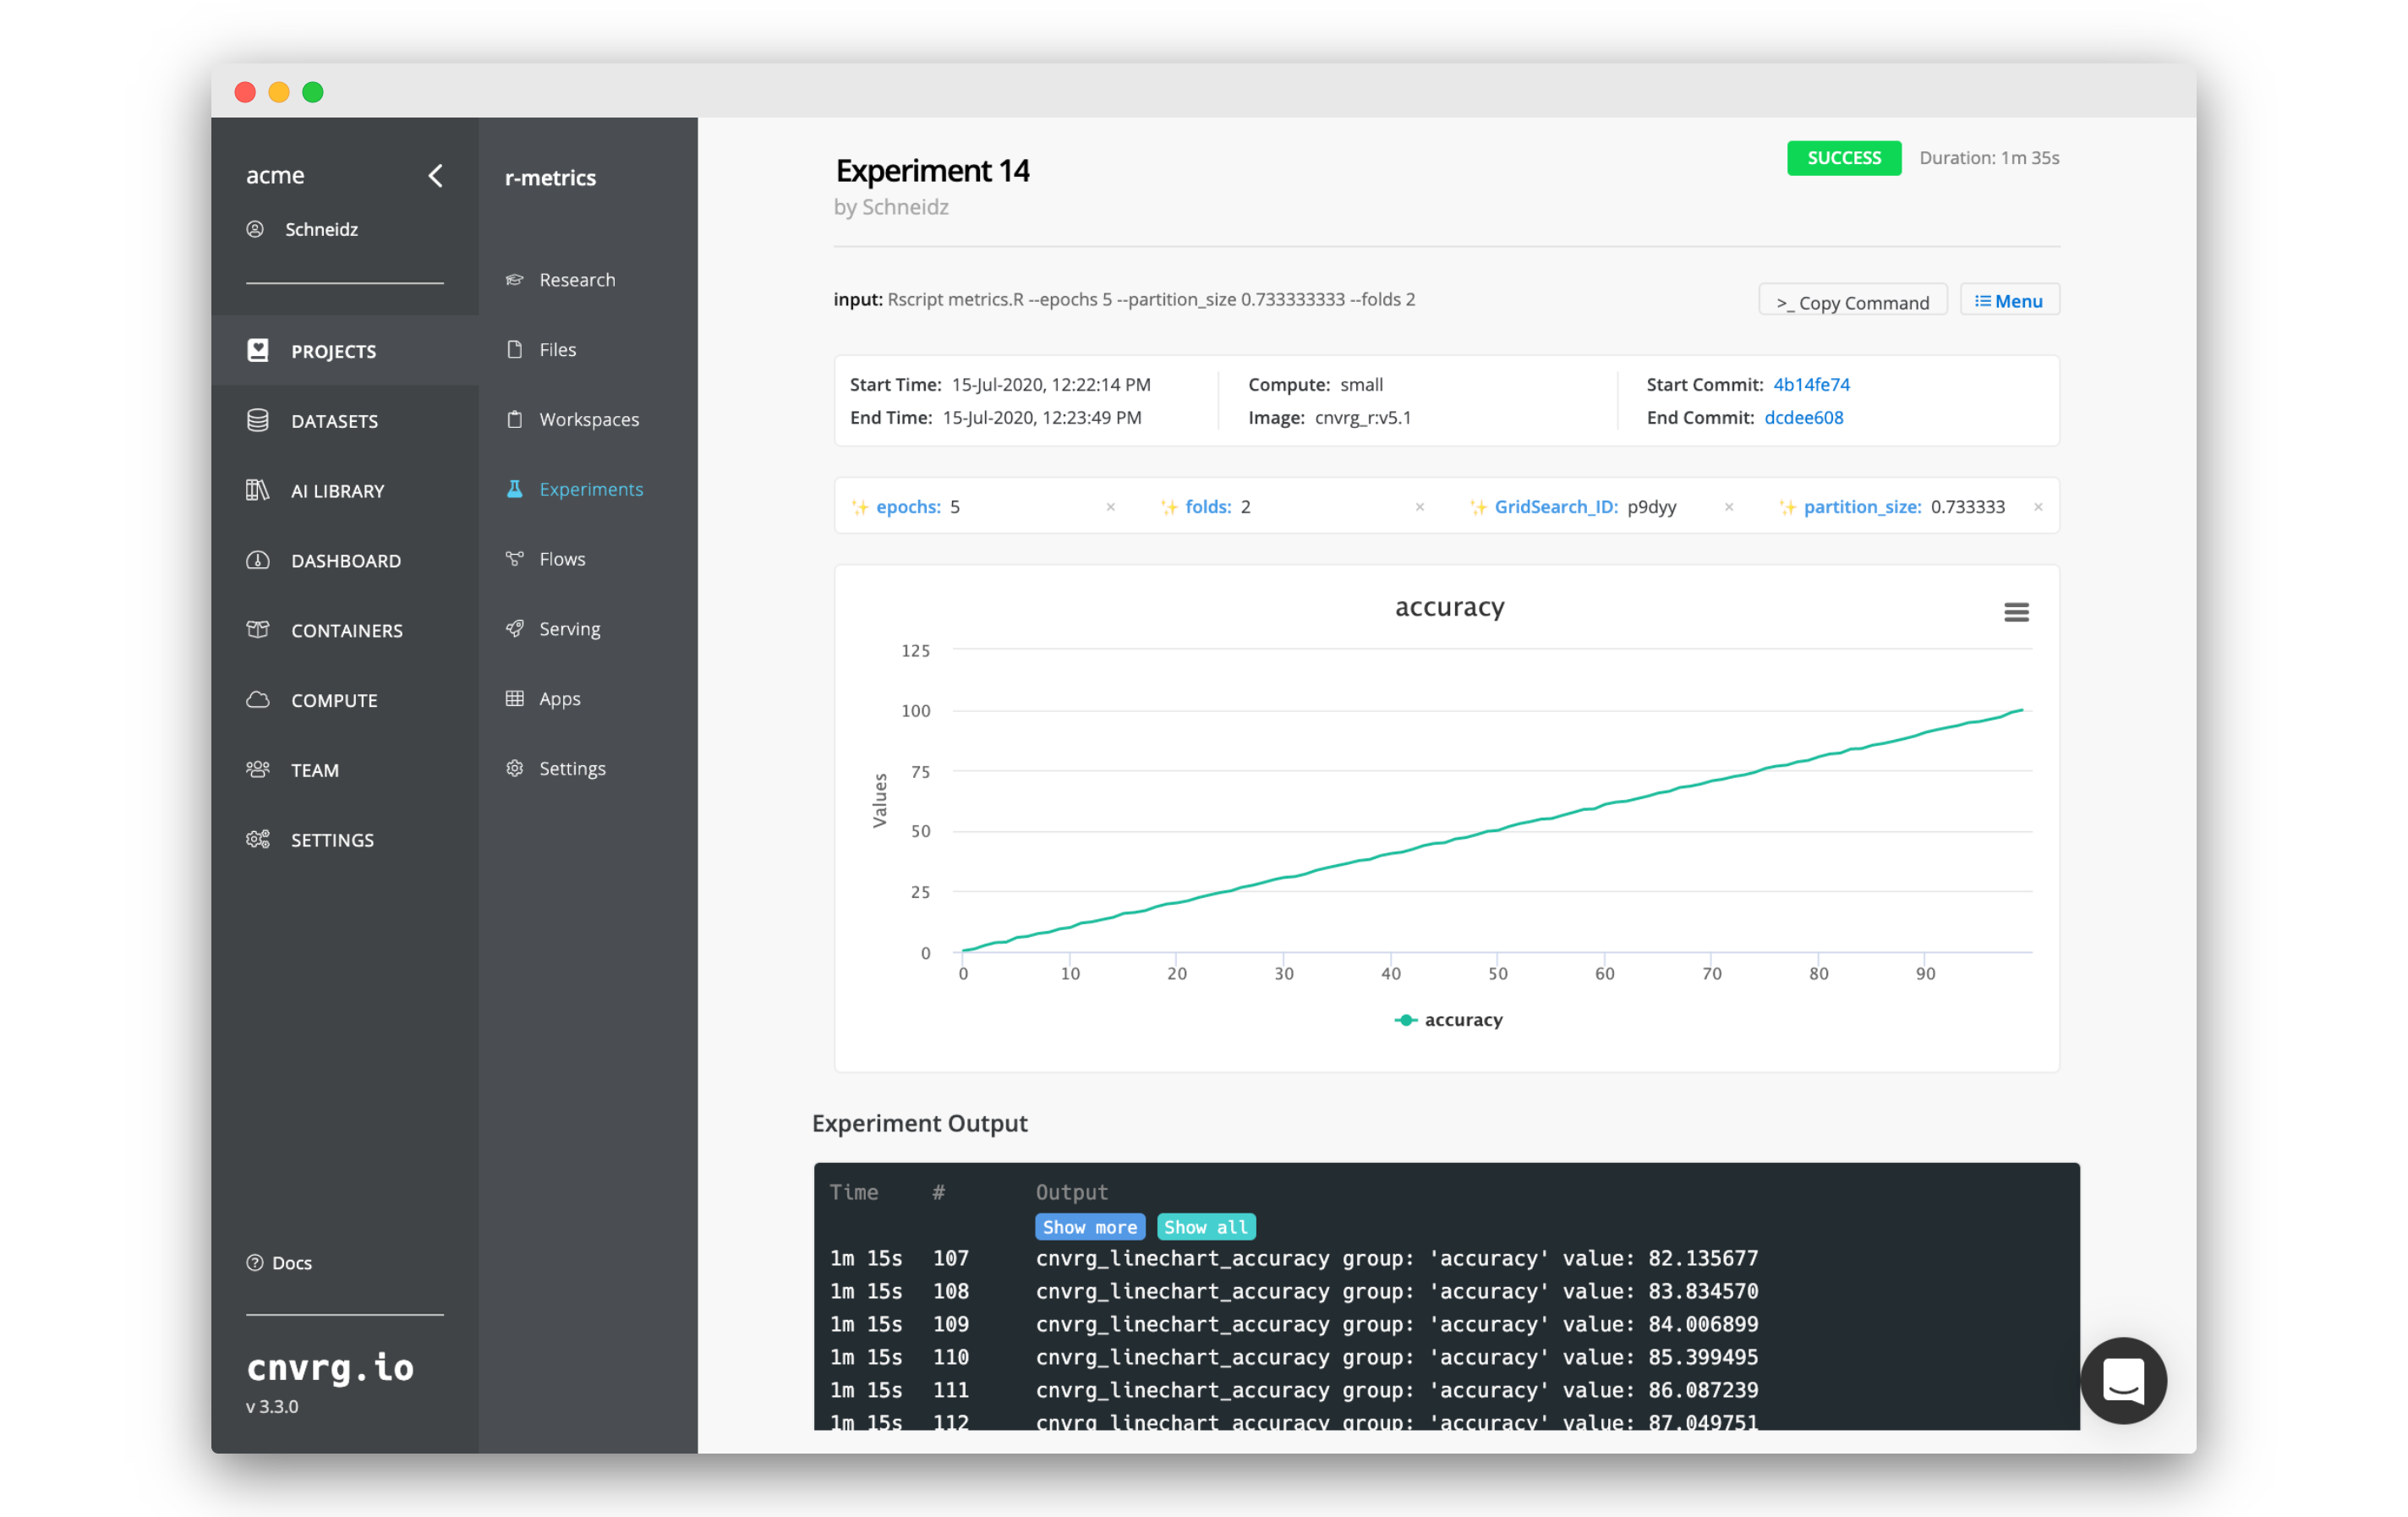
Click on any of the experiments to start viewing the information about that specific experiment. You get a full dashboard with all of the information about the code , logs and metrics.
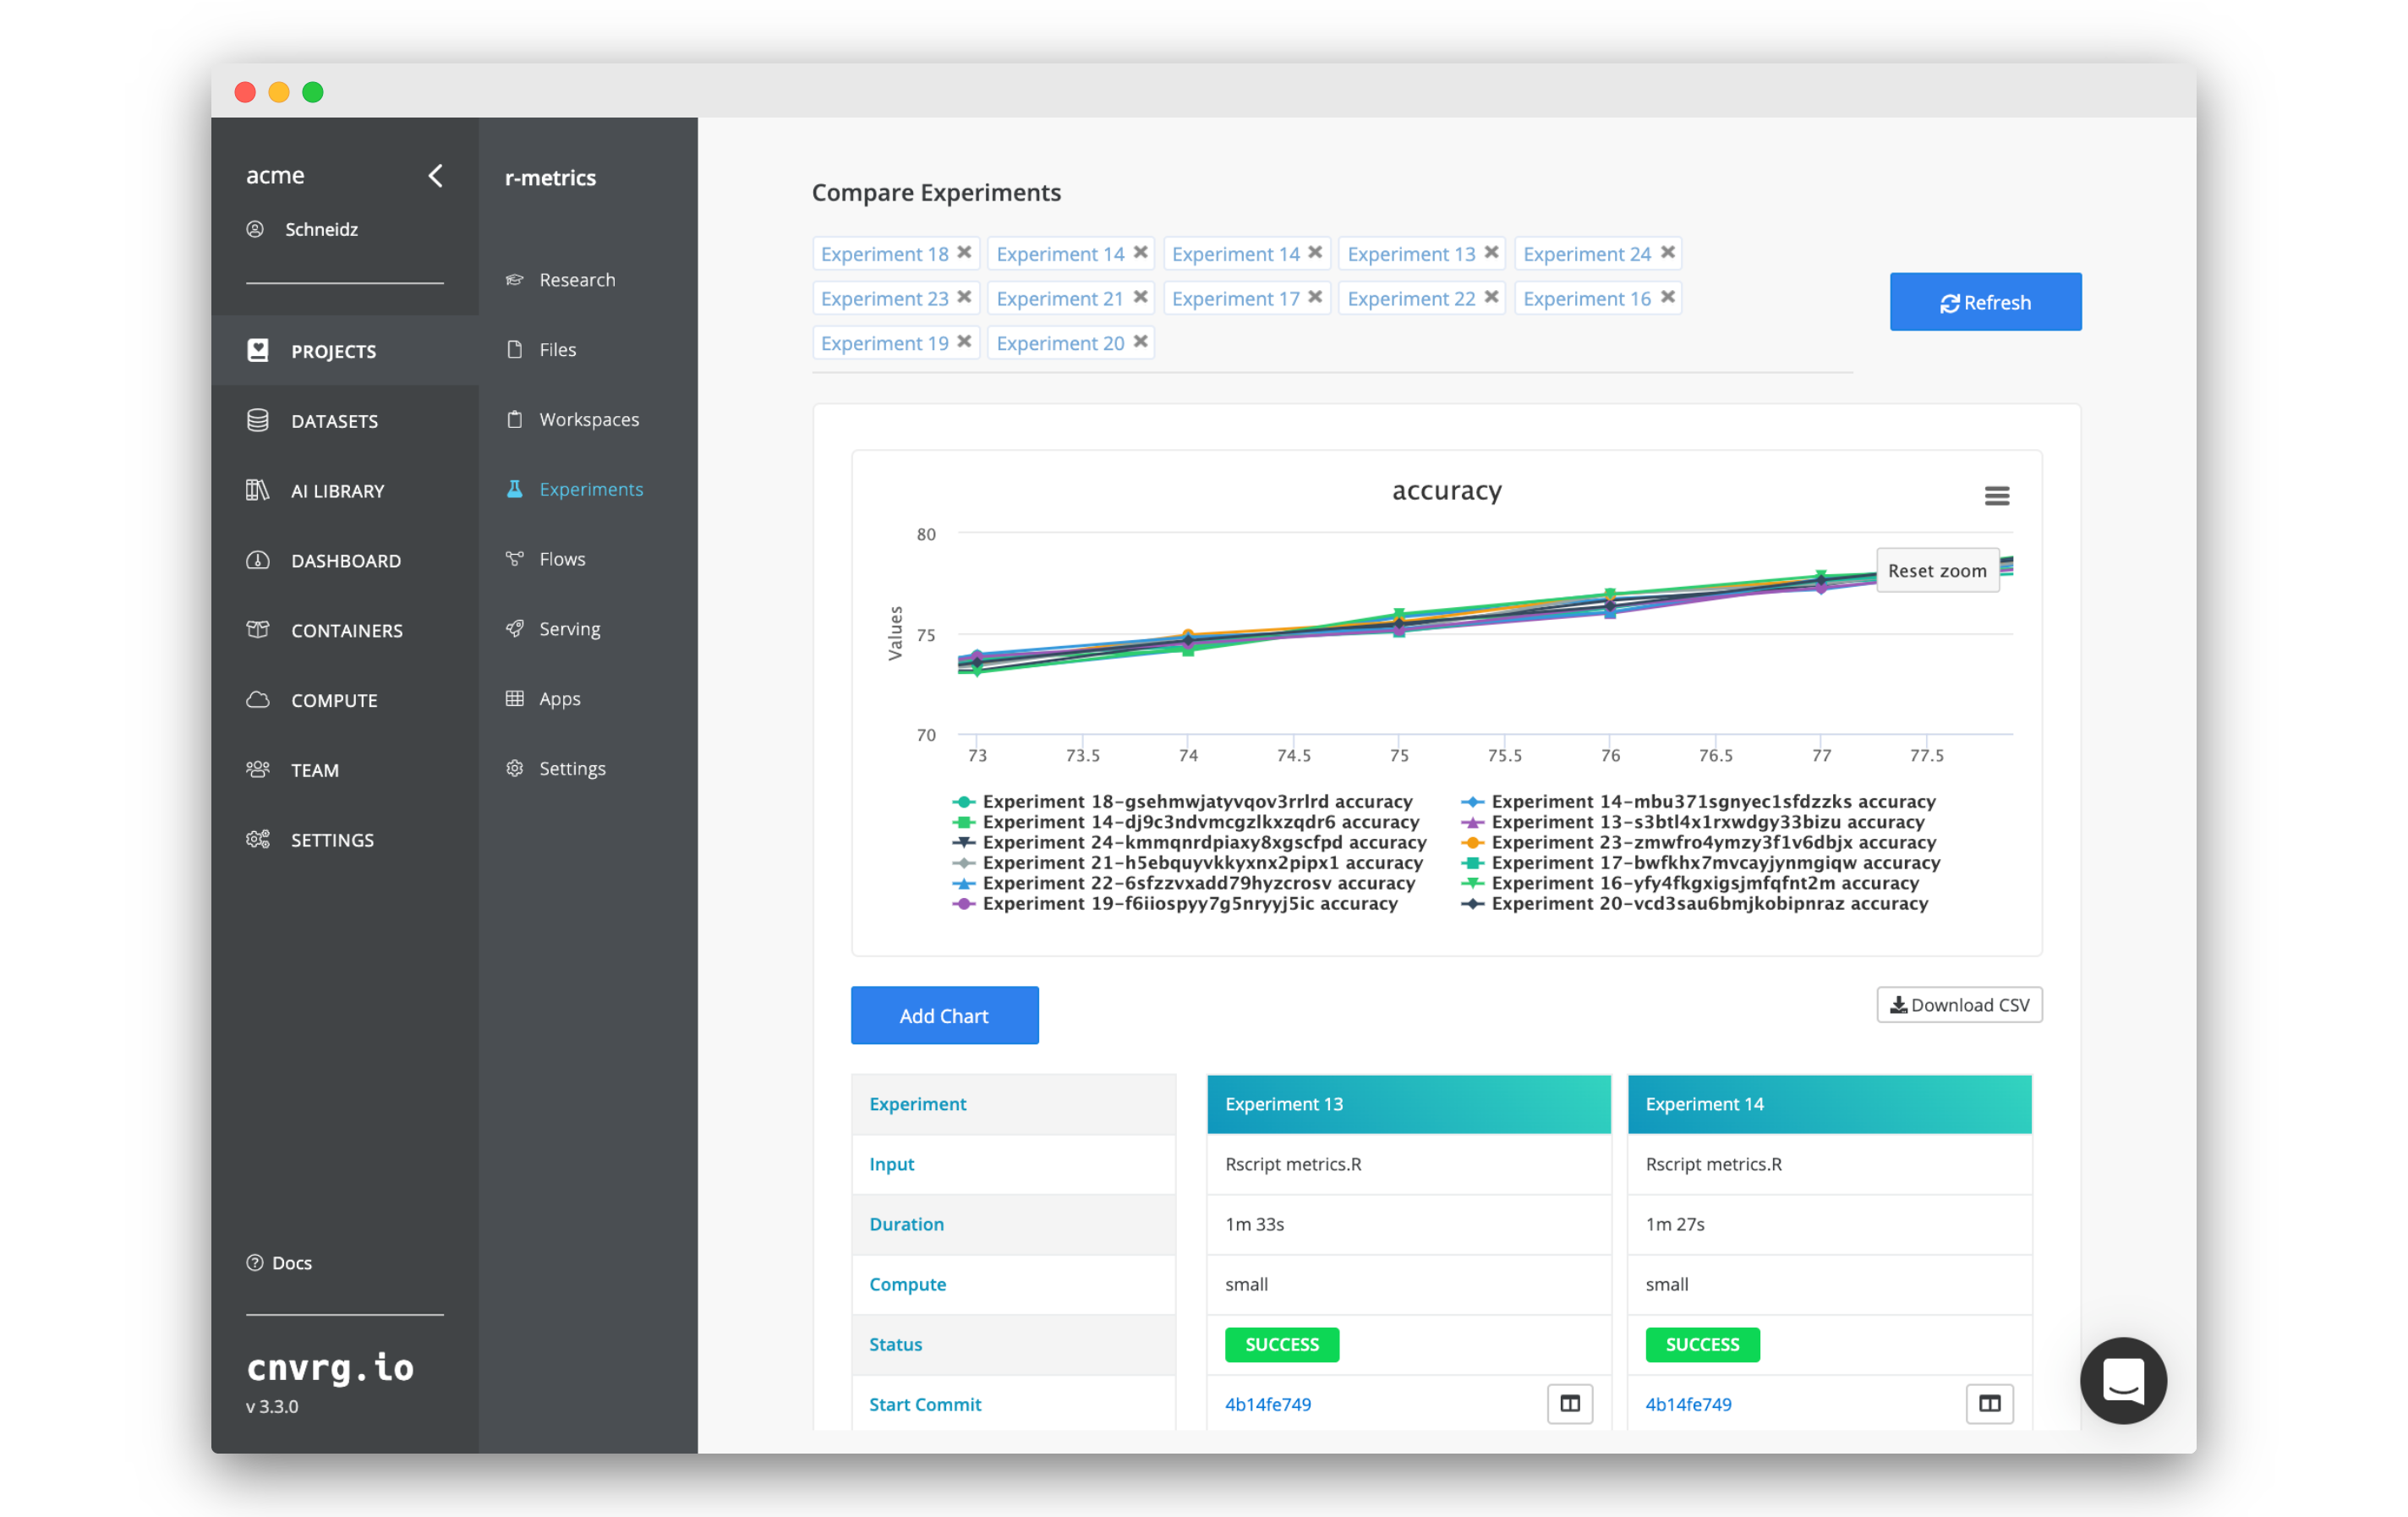
The experiments may take a few minutes to complete. You can also take a selection of the experiments and click Compare to generate a comparison dashboard.
You can use all of the same formatting and systems to add custom tracking to your own R experiments.