# Publish an R Shiny App using the Iris Example
In the following guide, we will cover all the steps to publish an R Shiny application in cnvrg. We will use the Classify Iris flowers with R example in the examples page.
We'll get to see how to use the Apps tab of cnvrg and put it into action!
# Clone the example
Navigate to the Projects tab. Now select Example Projects. Then, choose the project Classify Iris flowers with R and click Start.
# Browse the new project files
By choosing the example project, the app.R will be created within your new project. This file is a simple R file that contains the code to publish the application.
library(shiny)
library(ggplot2)  # for the diamonds dataset

ui <- fluidPage(
  title = "Examples of DataTables",
  sidebarLayout(
    sidebarPanel(
      conditionalPanel(
        'input.dataset === "diamonds"',
        checkboxGroupInput("show_vars", "Columns in diamonds to show:",
                           names(diamonds), selected = names(diamonds))
      ),
      conditionalPanel(
        'input.dataset === "mtcars"',
        helpText("Click the column header to sort a column.")
      ),
      conditionalPanel(
        'input.dataset === "iris"',
        helpText("Display 5 records by default.")
      )
    ),
    mainPanel(
      tabsetPanel(
        id = 'dataset',
        tabPanel("diamonds", DT::dataTableOutput("mytable1")),
        tabPanel("mtcars", DT::dataTableOutput("mytable2")),
        tabPanel("iris", DT::dataTableOutput("mytable3"))
      )
    )
  )
)

server <- function(input, output) {

  # choose columns to display
  diamonds2 = diamonds[sample(nrow(diamonds), 1000), ]
  output$mytable1 <- DT::renderDataTable({
    DT::datatable(diamonds2[, input$show_vars, drop = FALSE])
  })

  # sorted columns are colored now because CSS are attached to them
  output$mytable2 <- DT::renderDataTable({
    DT::datatable(mtcars, options = list(orderClasses = TRUE))
  })

  # customize the length drop-down menu; display 5 rows per page by default
  output$mytable3 <- DT::renderDataTable({
    DT::datatable(iris, options = list(lengthMenu = c(5, 30, 50), pageLength = 5))
  })

}

shinyApp(ui, server)
In the project files, we also have some files that are used for training the iris model.
# Create an App
To publish a file as an app, select Apps on the project's sidebar.
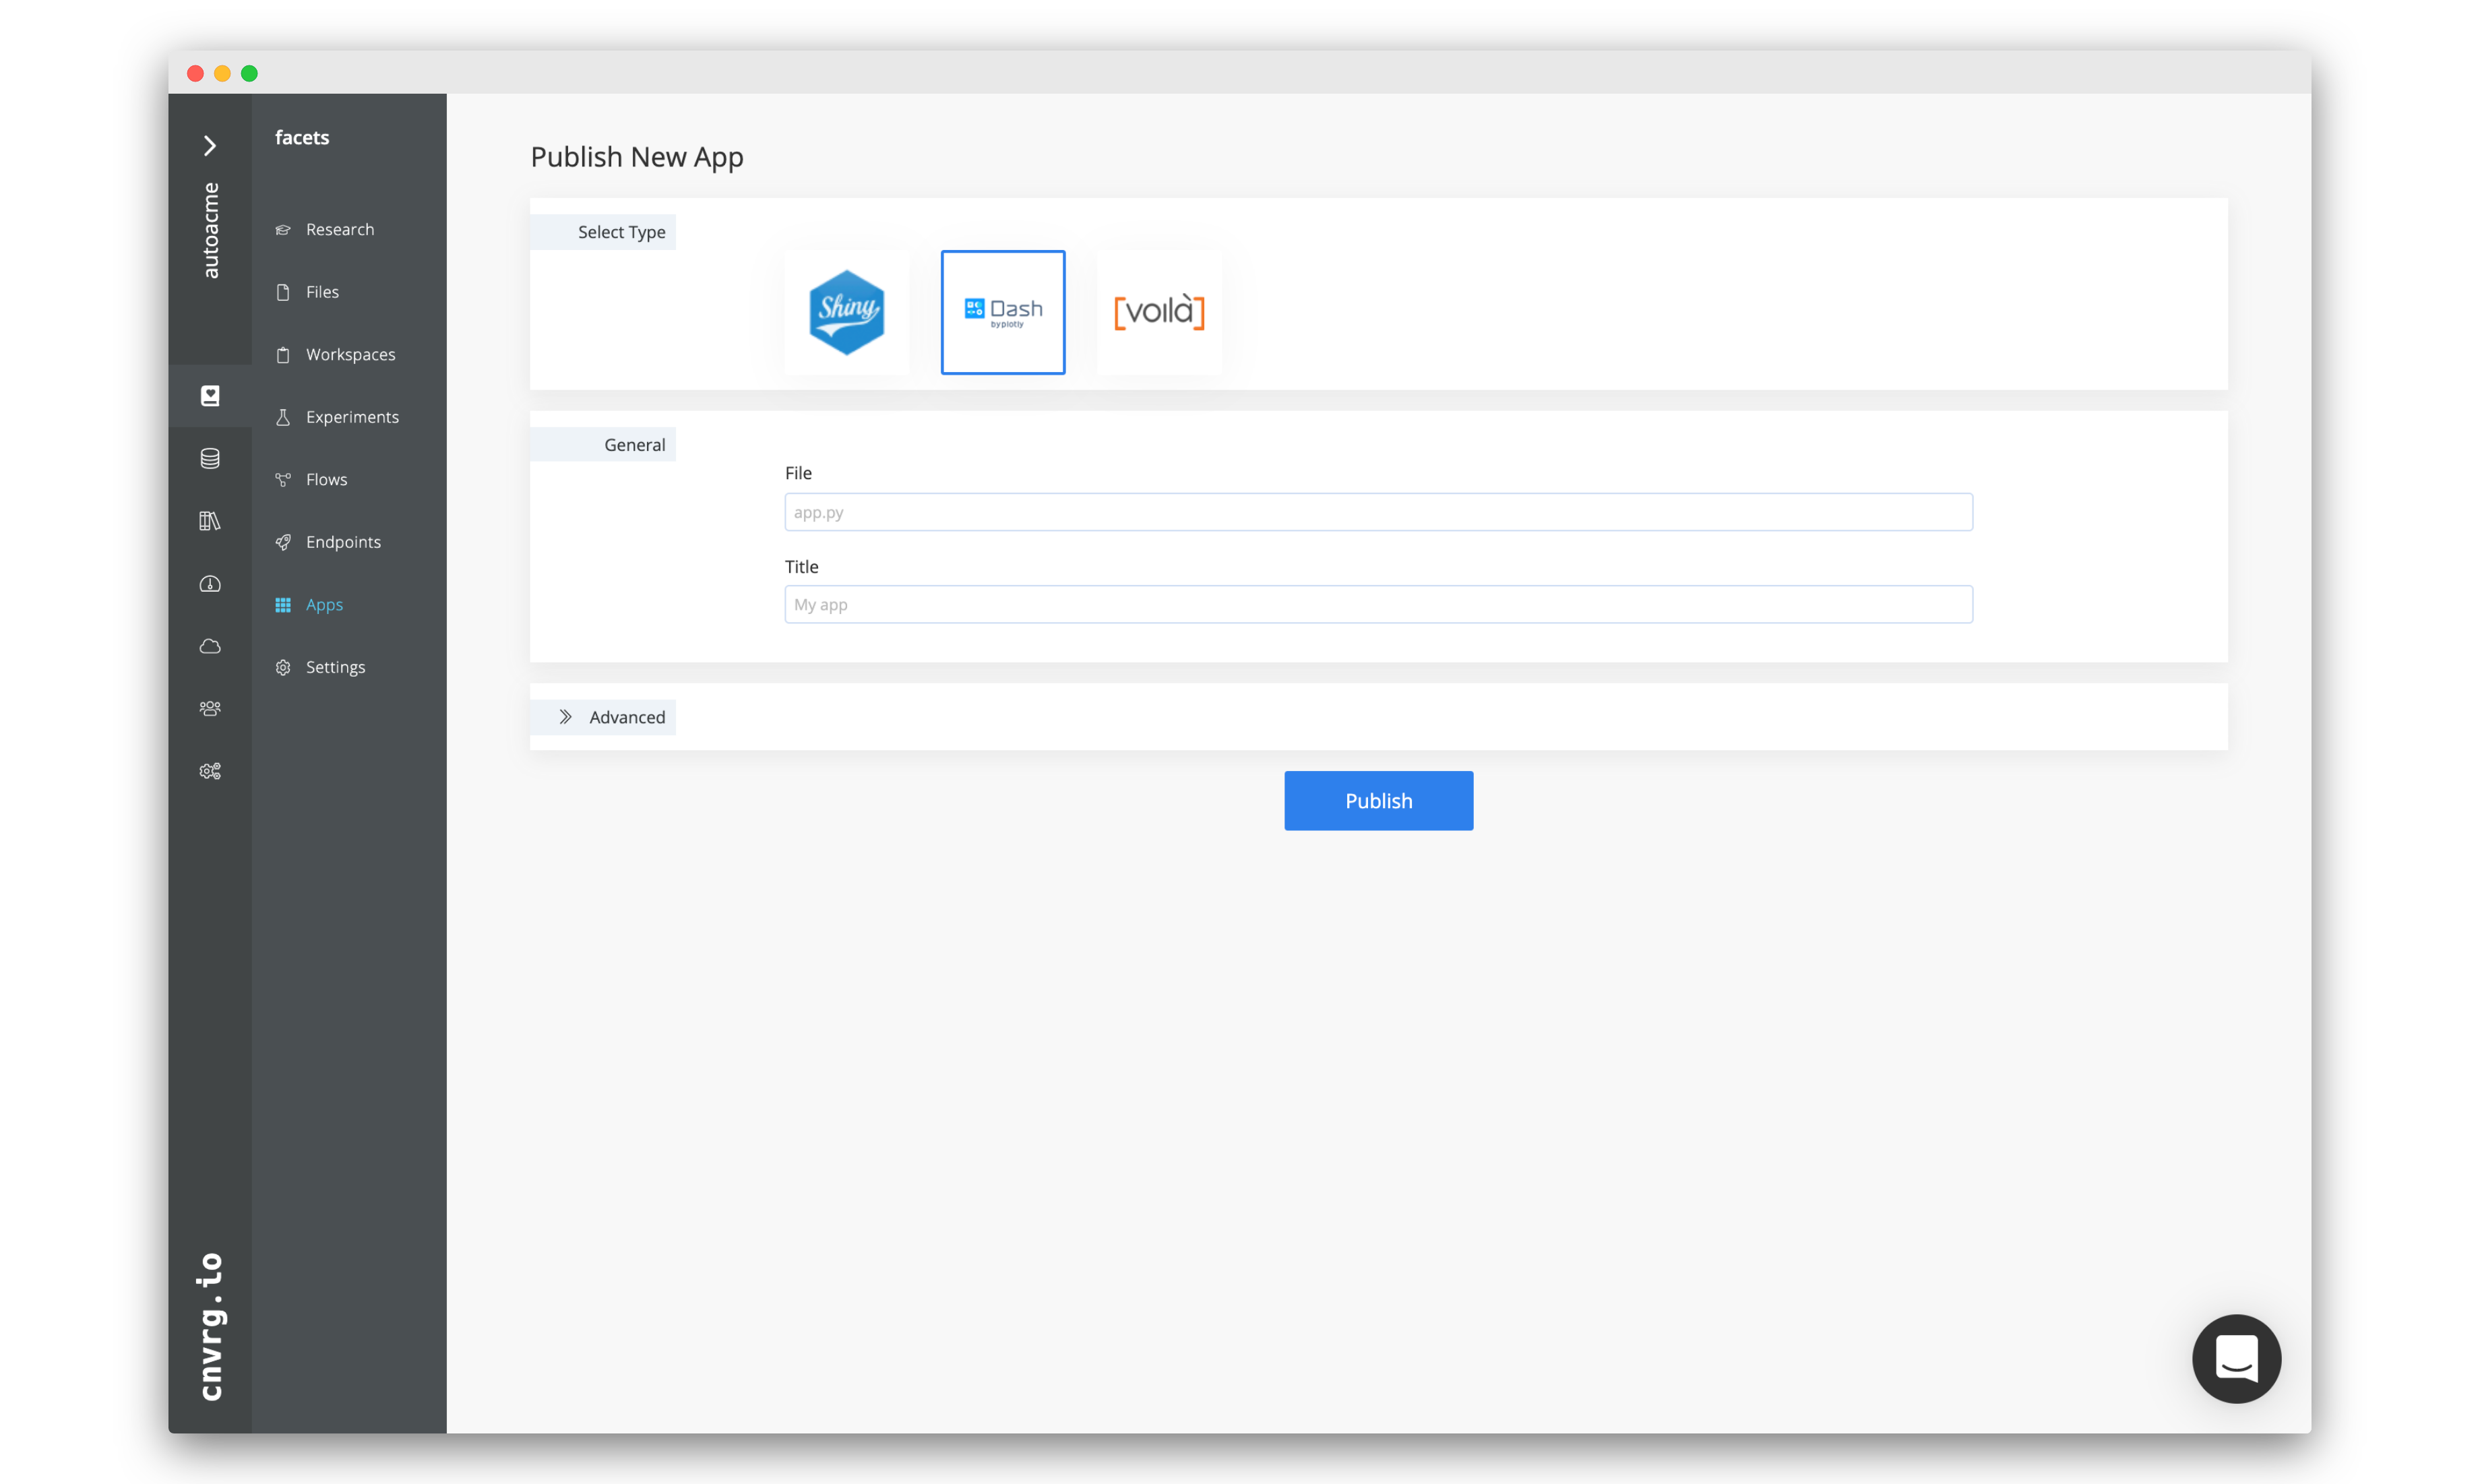
- Select the R Shiny icon.
- Enter the app name.
- Enter the name of the R Shiny File as
app.R. - For Advanced Settings > Compute, select medium.
- For Advanced Settings > Image, click cnvrg_r and choose the latest cnrvg R image.
- When you're ready, click Publish!
Then, cnvrg will spin up your chosen compute resources, with your project files, dataset and project dependencies - and wrap your app.R as an R Shiny app!
TIP
Once published, you can update the app's files version on demand.
# Share the App
Now that your app is up and running live, you can share the URL with your team members through the Share button. Additionally, you can make the app public, and let other non-cnvrg users view the app in read-only mode.