# Dashboard
Intel® Tiber™ AI Studio platform is an AI OS designed to help you effectively manage and utilize your compute resources. This is enabled through the Dashboard tab of your Organization.
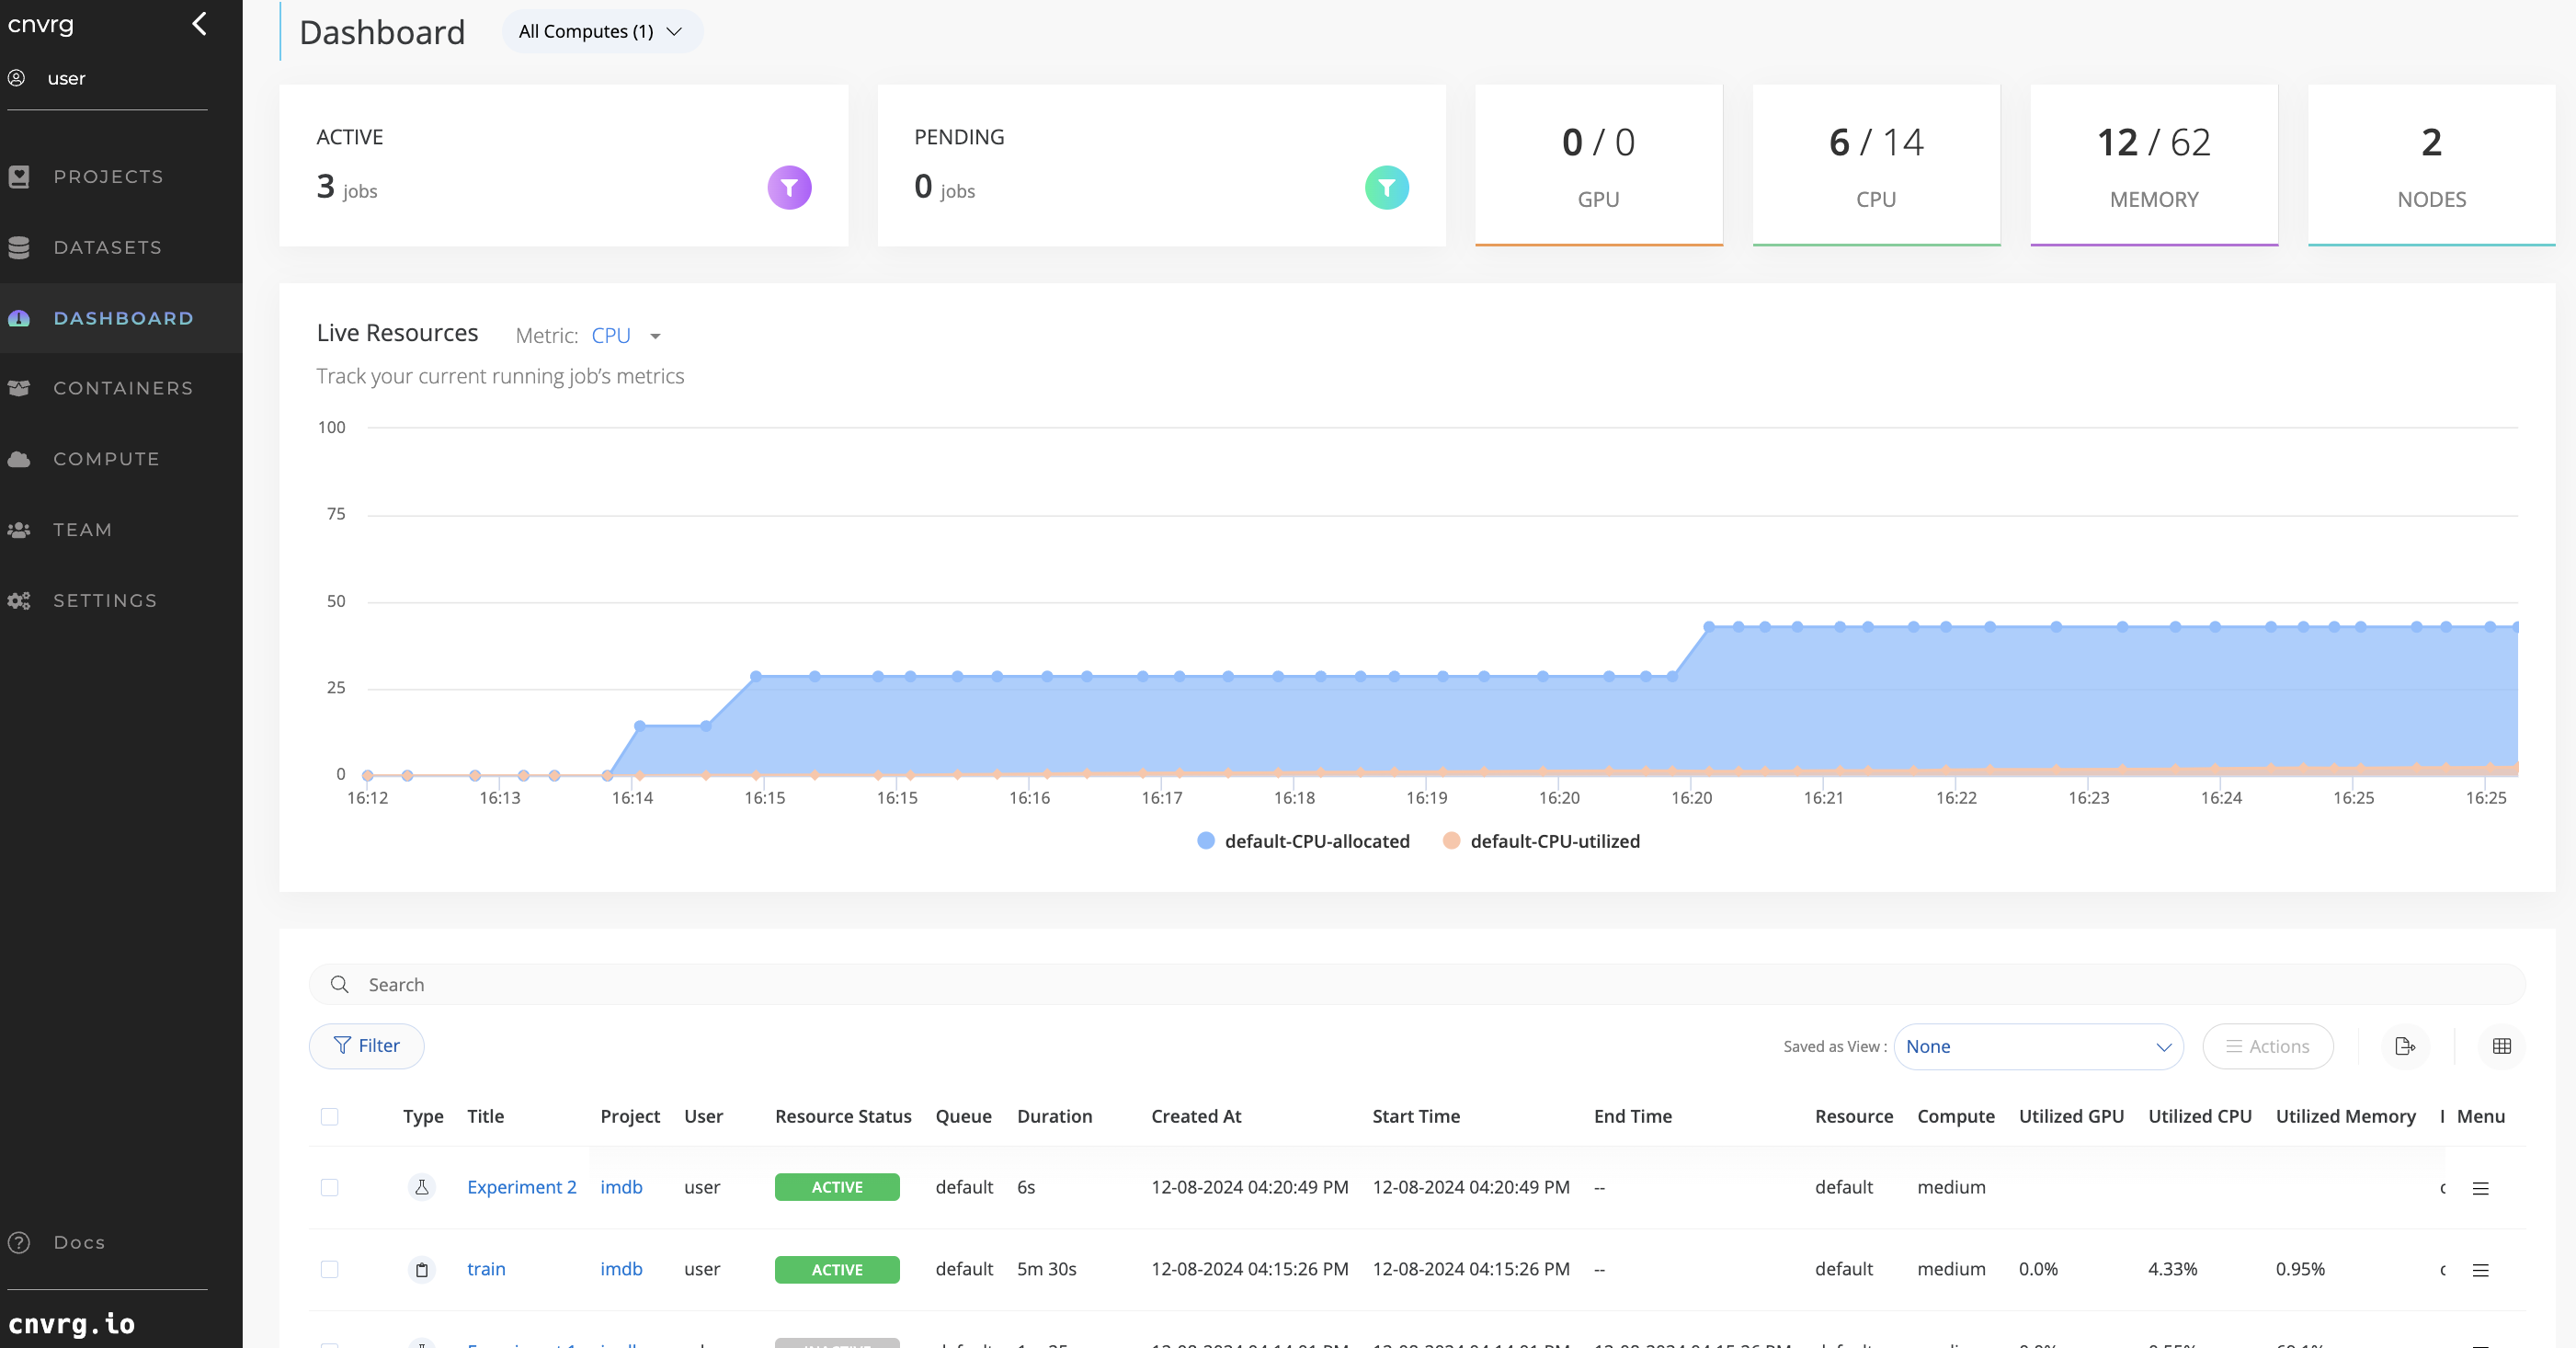
Inside the Dashboard tab, you get a complete overview of how your resources are allocated and utilized.
The topics in this page:
# Summary
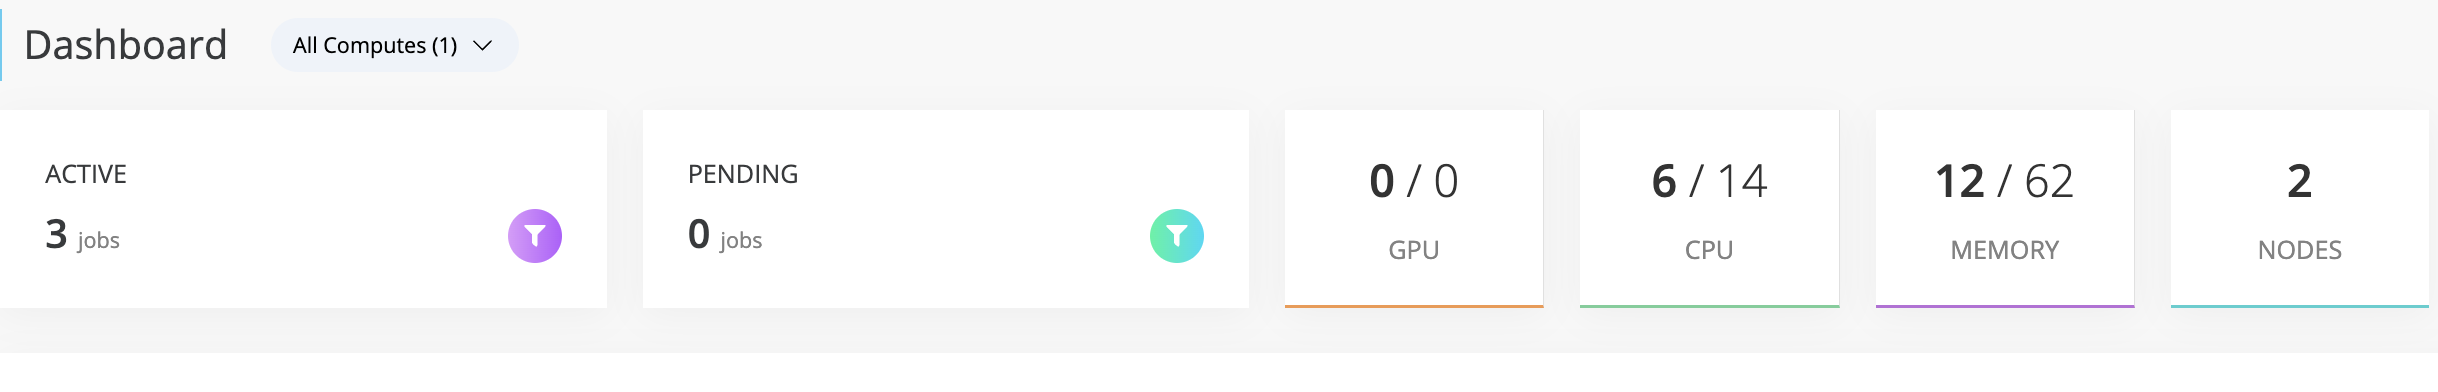
Along the top of the page, there is an overview of the current status of all your jobs and compute allocations over your entire Organization and all of your compute resources.
The summary displays:
- Current active jobs
- Current pending jobs (queued or initializing)
- Amount of Compute Resources
- Assigned and total available GPU cores
- Assigned and total available CPU cores
- Assigned and total memory
- Number of nodes among your compute resources
# Live Resources Chart
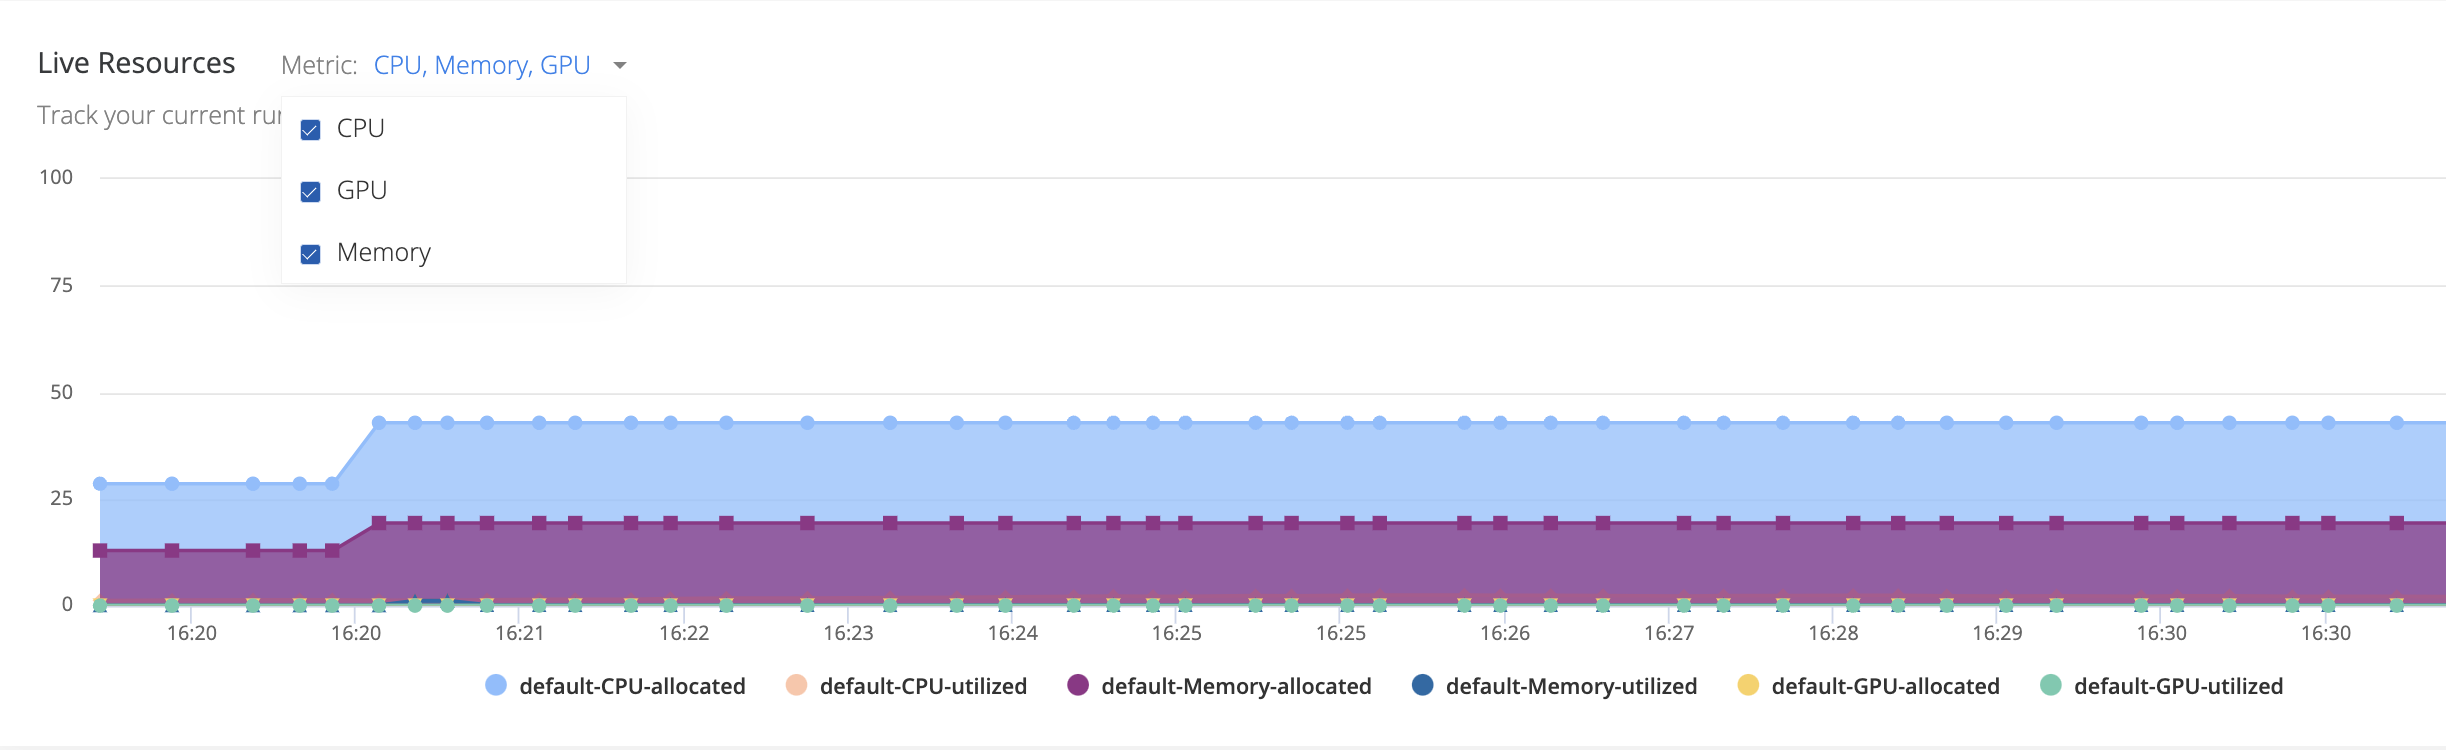
The Live Resources graph provides live insights into the allocation and utilization for each of your compute resources. Each resource has a line representing allocation (% of full cluster) and a line representing utilization (% of full cluster) for CPU, GPU and memory.
Highlight a line on the graph by hovering over its name. Click its name to toggle the line's visibility on and off.
The Metric menu toggles on and off visibility of CPU, GPU and memory metrics.
The Compute menu allows to toggle on and off visibility for each resource individually or enable All.
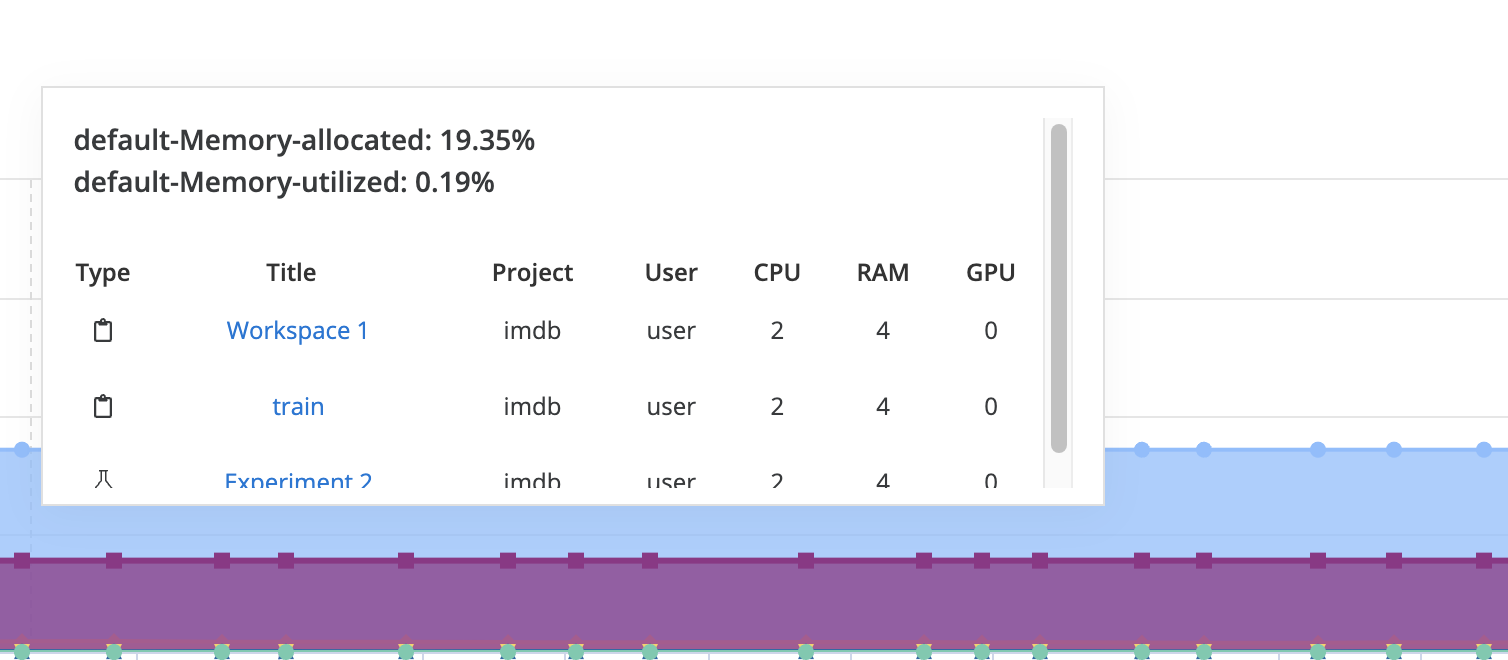
When you hover over a data point on the graph, a tooltip appears showing the allocation and utilization for that metric (CPU,GPU or memory) and the relevant jobs.
# Job Table
Below the Live Resources chart is the Job Table. This contains a full list of all current and historical jobs run in the Organization, along with accompanying utilization metadata. All metadata is on a per job basis, for instance, Utilized CPU refers to the portion of the allocated CPU for the specific job was utilized by the job.
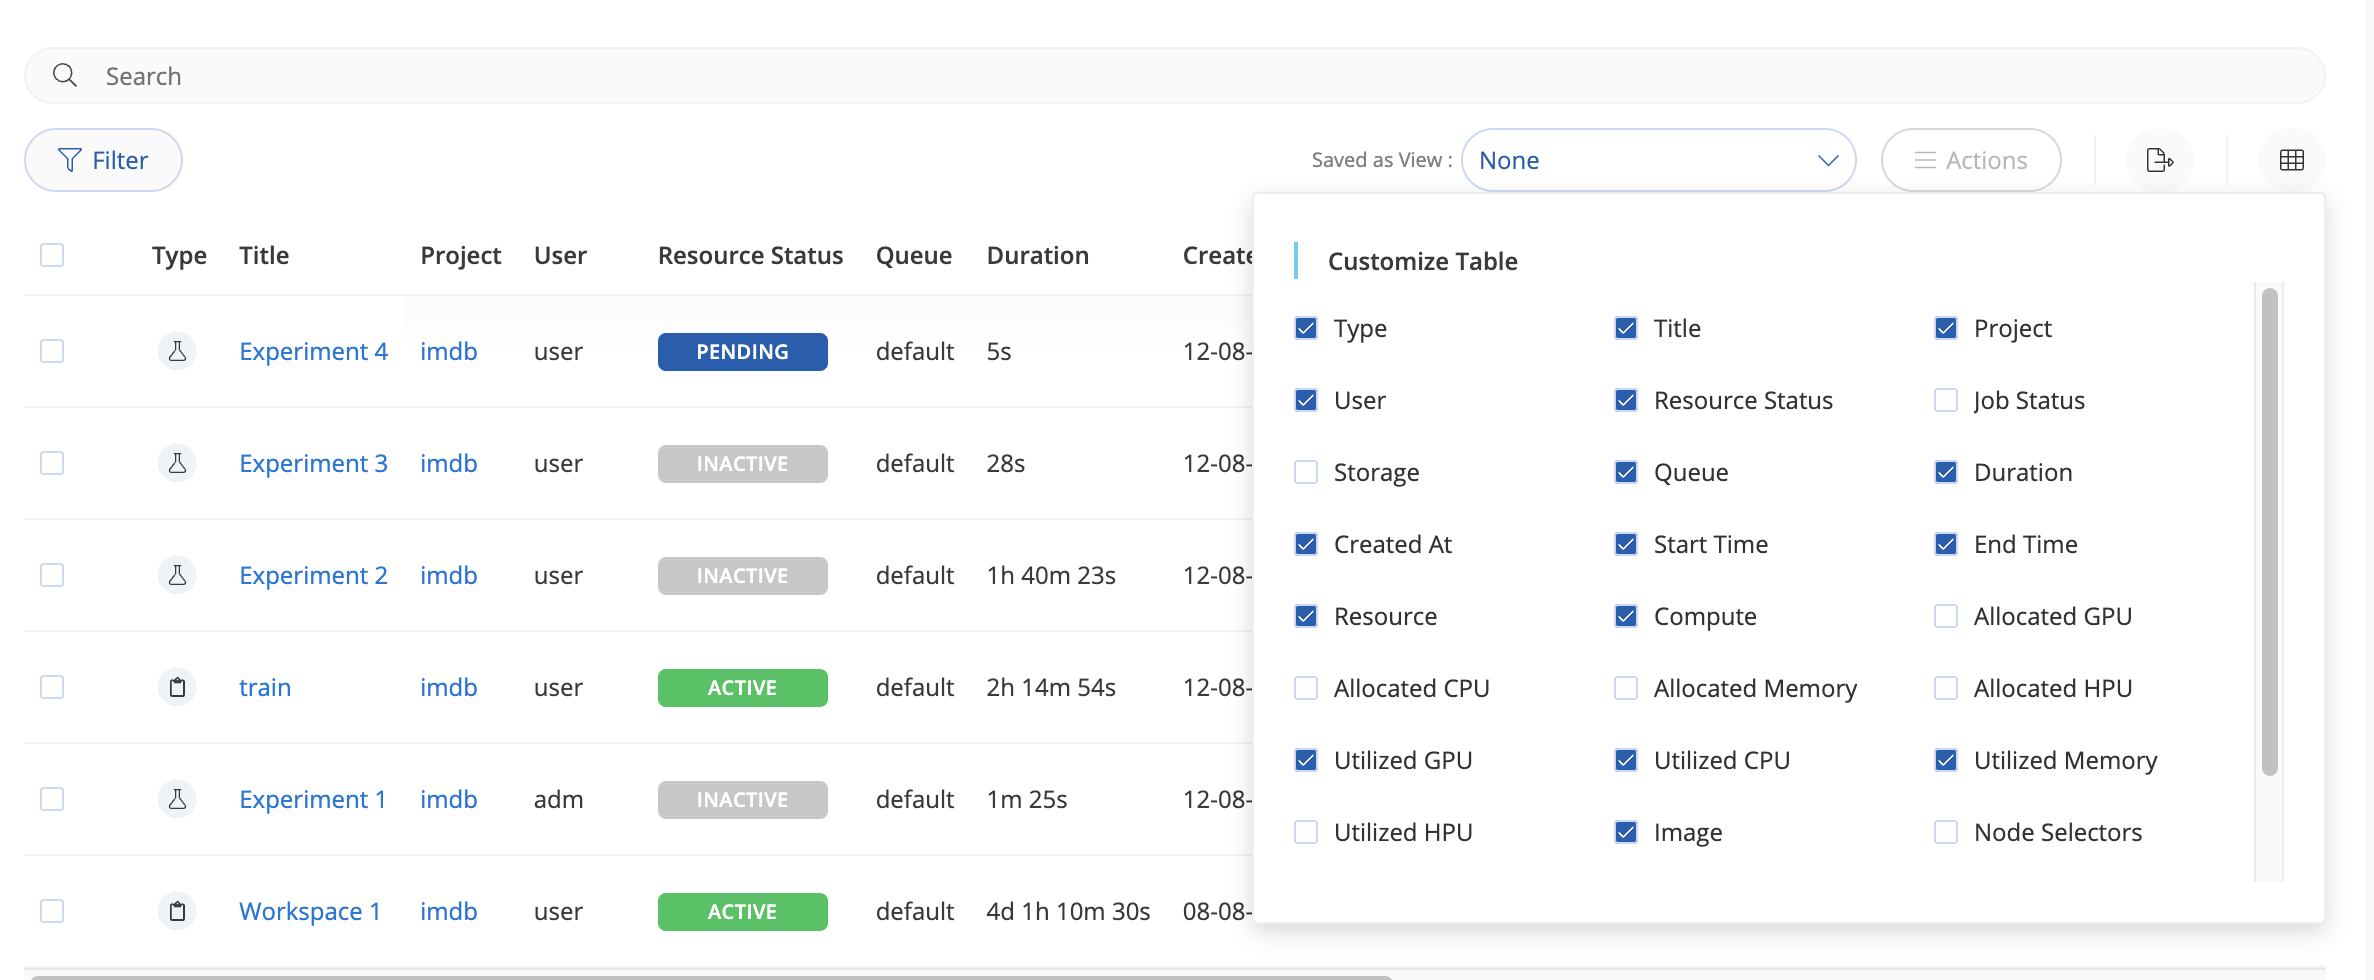
# Customize the table
You can control the columns that appear in the table by clicking the Customize button. The following fields can be chosen:
- Type: The type of job (Experiment, Workspace, Endpoint or App).
- Title: The name of the job.
- Project: The Project the job belongs to.
- User: The user who started the job.
- Status: The resource utilization status (active, inactive or pending).
- Job Status: The status of the job itself (initializing, ongoing, success, aborted, error or scheduled)
- Duration: Length of time the job has been running (current or total).
- Created At: When the job was created.
- Resource: The compute resource used.
- Compute: The compute template used.
- Allocated GPU: Total allocated GPU for the job.
- Allocated CPU: Total allocated CPU for the job.
- Allocated Memory: Total allocated memory for the job.
- Utilized GPU: Percentage of allocated GPU utilized by job.
- Utilized CPU: Percentage of allocated CPU utilized by job.
- Utilized Memory: Percentage of allocated memory utilized by job.
- Image: Container used by job.
- Node Selectors: Any Kubernetes selector used for choosing node/node pool.
- Datasets Attached: Datasets used by job.
- Datasets Size: Size of Dataset used by job.
# Filters
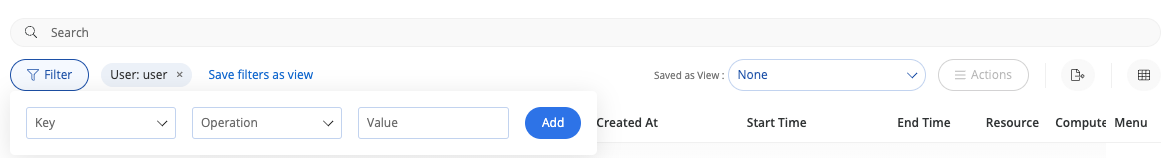
Filters are designed to save users time and enhance the workflow by preserving your filter selections. This feature is available on the Projects, Datasets, Experiment Table, and Dashboard pages
Filter the table by clicking the Filter button. Then add one or more Key, Operation and Value combinations to filter the table. Added filters appear along the top of the table.
Key Capabilities:
- Save: Save the filters you create so you don’t have to apply them every time you navigate to a page
- Name Your Filter: Give each saved filter a unique name for easy identification
- Delete: Remove any saved filters you no longer need
- Remove: Clear all applied filters to view data without any filters. For each added filter, you can remove it by clicking the X corresponding to the filter.
# Search through the table
You can use the Search bar to search the table by Project, user and title. The search is case-sensitive.
← Datasets Workspaces →