# Experiments
The Intel® Tiber™ AI Studio platform provides the capability to run an experiment, which can be any executable written in any language such as Python (for example,python neuralnet.py), R, Java, and Scala. It can also be an existing Jupyter Notebook.
A user can run an experiment on any remote compute (cloud-based or on-premises) by using the following four methods: the AI Studio web UI, CLI, SDK, or API calls. Users also have the option to stop, delete, and rerun experiments.
When running an experiment, AI Studio automatically takes a snapshot of the code, launches a worker, installs all dependencies (Docker-based), and runs the experiment. After it is completed, cnvrg frees up resources for other jobs.
If running an experiment in the cloud, AI Studio automatically launches an instance, runs the experiment, and shuts down the instance when it is finished.
When an experiment is running, AI Studio provides users the ability to track live exactly what occurs during the session. All standard output is visible, and resource usage (like GPU, CPU, RAM, and disk IO) are periodically checked and reported.
The topics in this page:
- Constructing Experiment Environments
- Running Experiments
- Applying Use Cases
- Using Datasets
- Tracking and Visualizing
- Running Grid Searches and Optimizing Hyperparameters
- Producing Experiment Artifacts
- Rerunning Experiments
- Comparing and Organizing
- Troubleshooting Experiments
- Using TensorBoard and Terminal
- Performing Other Options
# Constructing Experiment Environments
Similar to the execution of any other ML workload, when an experiment runs, AI Studio constructs its environment as outlined in the following steps:
- Pulls and executes the selected container.
- Clones the selected Git branch and commit (if the project is connected to Git) into
/cnvrg. - Clones the latest version of the files from your projects Files tab (or the selected AI Studio commit) into
/cnvrg. - Clones or attaches the selected datasets into
/data. - Installs packages from the
requirements.txtfile (if it exists). - Executes the
prerun.shscript (if it exists).
When cnvrg completes these steps, the environment is fully constructed and the command is executed.
For more information see Environment.
# Running Experiments
Experiments can be run locally on an on-premise machine or on a AI Studio remote machine.
There are several ways to run cnvrg experiments:
# Using the web UI
To run an experiment through the web UI, go to your project, click the Experiments tab and then New Experiment.

The New Experiment page is divided into sections grouped by category. Click each tab arrow to open its section and provide the required details.
Or, click Open All to expand all the sections.
After providing the details (described in the sections below), click Run and AI Studio starts running the experiment according to the selections.
A default run template for each project can also be saved. First, provide the details on the New Experiment page to set as default. Then, click Save as default template and confirm your decision to apply the changes. Whenever running a new experiment, the details selected are loaded automatically.
# General

The General section includes the following items to configure:
- Command to Execute: Provide the command the remote compute runs for the experiment (for example,
python3 train.py). - Working Directory: Click Change to customize the working directory where the command executes. For example, if the script to execute is in a sub-folder named
scripts/, set/cnvrg/scripts/as the working directory. The default can be set in project settings. - Title (optional): Enter a title for your experiment. By default, the experiments are named
Experiment #(# is the number of previously run experiments, plus 1).
TIP
Dynamically set the title of the experiment using the AI Studio Research Assistant.
# Parameters

In this section, add the parameters to use when running a grid search. Add all the required parameters and AI Studio dynamically creates experiments for all the permutations of parameters.
Complete the following steps to add a parameter:
Click Add to add a parameter.
For each of the four parameter types, specify key-value pairs in the fields, as required:
- Float: Scale between float values. Specify minimum and maximum values, the number of steps, and the desired scale (Linear, Log2, or Log10). For example, say the key is
learning_rate, the values are:Min=0,Max=1,Scale=Linear, andSteps=10. - Discrete: Comma-separated integers. Designate discrete values. For example, say the key is
epochs, the values are:10,20,100. - Categorical: Comma-separated strings. Specify a list of values. For example, say they are
1,5,9,13, cnvrg adds""to either side of the values. For example, say the key isoptimizer, the values are:Adamandsgd. - Integer: Scale between integer values. Specify minimum and maximum values, the number of steps, and the desired scale (Linear, Log2, or Log10). For example, say the key is
folds, the values are:Min=1,Max=1000,Scale=Log10andSteps=3.
- Float: Scale between float values. Specify minimum and maximum values, the number of steps, and the desired scale (Linear, Log2, or Log10). For example, say the key is
The number of experiments to be run display in the top right corner of the panel.
TIP
Information on managing the inputs from this feature can be found here.
# Datasets

In this section, use the Datasets drop-down menu to select one or more datasets to be mounted on the remote compute for the experiment. Also, select specific commits or queries on any of your datasets, as required.
The dataset is accessible at the absolute path: /data/name_of_dataset/.
TIP
More information on using datasets can be found here.
# Git Integration
NOTE
The following section is relevant only if the project is integrated with Git. Refer to Git Intetration.

If your project is integrated with a Git repository, configure the following Git integration items:
- Git Branch: Provide the name of the Git branch to clone (default is
master). - Git Commit: Provide the name of the specific Git commit to clone (default is
latest). - cnvrg.io Commit: Use the search field or drop-down list to load an output directory of a previous job. Your new experiment starts at that point and accesses the files from that cnvrg commit (i.e., its artifacts).
- Output Folder: Set the correct directory or path so cnvrg can locate files the experiment produces. Even when connected to Git, AI Studio manages the versioning of experiment artifacts.
WARNING
Ensure the Output Folder matches the location where your code saves its changes and files. Otherwise, AI Studio cannot sync and version them.
# Environment

In this section, choose the settings to create the environment for the experiment run:
- Compute: Select one or more compute templates on which the experiment runs. If the first compute is unavailable, the experiment attempts to run on the next selected compute, and so on. If you select only one compute template, the experiment waits until it is available to run.
- Image: Select the Docker image to serve as the basis of the experiment.
TIP
More information on setting up your environment can be found here.
# Scheduling

In this section, schedule the experiment to run at a specific time or on a recurring basis using one of the following three options:
- Now: Run the experiment immediately.
- Schedule: Run once at a selected date and time.
- Recurring: Run the experiment repeatedly based on a timing rule.
# More

The More section includes additional options to configure:
AutoSync: When enabled, AI Studio commits the experiment's artifacts every 60 minutes. Note: The time can be configured in the project's settings.
Restart when idle: When enabled, the experiment automatically restarts if logs are not printed for more than 60 minutes.
Email Notifications: There are two email notification options when running experiments:
- On Success: If enabled, AI Studio sends an email when the experiment ends successfully.
- On Error: If enabled, AI Studio sends an email when an error occurs during the experiment run.
Users can also enable email notifications using the CLI and SDK, as discussed in the following sections.
TIP
Users can set a default behavior for email notifications in their project settings. Go to Settings > Environment > Email notifications and toggle on notifications for success or error.
# Using the CLI
To run an experiment using the CLI, go to the project directory, create a project, and add the cnvrgv2 experiment run prefix to the command as follows:
cnvrgv2 experiment run --command=python myscript.py
A link is immediately sent to track the progress of the experiment through the web UI.
TIP
To run the experiment locally, use the --local flag (or -l).
Experiments use the default organization or user settings, which can be edited on an experiment basis by using the different flags.
To enable email notifications with the CLI, use the --notify_on_success and --notify_on_error flags.
cnvrg run --notify_on_success --notify_on_error python3 train.py
There are many commands to control experiment properties. Choose any combination of commands according to requirements. If specific commands are not used, cnvrg uses the default settings.
The following code provides an example experiment run command:
cnvrg run --datasets='[{id:d3-new,commit:dd7c1a3d9d5627da9aea5415e3d07202bfb5925e}, {id:d4,commit:3028f51407d83338f72f994bc283572452a877de}]' --git_branch=master --git_commit=0a787d11e1e2f01b15ac63599ebed3777f21dab8 --output_dir=output --machine="gpu" --sync_before=false python3 train.py
For more information about the cnvrg CLI and the flags available with the run command, see cnvrg CLI documentation.
# Using the cnvrg SDK
To run a new experiment using the cnvrg SDK, use the experiment.run() method:
from cnvrg import Experiment
e=Experiment.run('python3 train.py', title="SDK Experiment", compute='medium')
The code starts running an experiment on a remote compute and syncs the status with cnvrg.
To enable email notifications when running an experiment, use the notify_on_success and notify_on_error parameters in experiment.run().
e = Experiment.run('python3 train.py', notify_on_success=True, notify_on_error=True)
There are many different arguments to use in the command. For more information on these SDK options, refer to the cnvrg SDK documentation.
# Applying Use Cases
A cnvrg experiment can be any form of code, so there are many different types of experiments that can be run within the platform.
# Preprocessing datasets
One cnvrg experiment type is a processing code run. Select the relevant dataset to attach to the experiment and set the command to execute (for example, Rscript preprocess.R).
To update the cnvrg dataset with the processed data, run the cnvrg data sync CLI command as part of the code in the dataset directory. Information on where your dataset is located in the remote compute can be found here.
# Training ML models
Another cnvrg experiment type is an ML model training run. As cnvrg is completely code and package agnostic, users can train an NLP TensorFlow model using Python, train a recurrent network based on Keras in R, or train their own custom modeling code, among many other model training operations.
To train a model, set the command to execute exactly as done on a machine (for example, python3 train.py).
The cnvrg default Docker images support most standard use cases and update regularly. Learn more about using a custom Docker image to support a specific use case here.
TIP
Remember to use grid searches and experiment visualization to optimize model training within cnvrg experiments.
# Running Jupyter Notebooks as experiments
Run existing Jupyter Notebooks as experiments by using the jupyter nbconvert command, which automatically runs the code inside the notebook.
In this command, use the following syntax:
jupyter nbconvert --to notebook --execute "notebook_path/some_notebook.ipynb"
NOTE
The output is rendered inside an updated Jupyter Notebook file.
# Using Datasets
When starting an experiment, cnvrg provides the option to select one or more datasets. A user can also select a specific query or commit of the dataset at this point.
When selecting a dataset with an experiment, cnvrg mounts it in the remote compute and makes it accessible from the absolute path: /data/name_of_dataset/.
For example, when running an experiment, if you include the dataset hotdogs, it and all of its files can be found in the /data/hotdogs/ directory.
TIP
Parameterizing the dataset slug and using the cnvrg hyperparameter parsing features can be useful.
Doing so can help avoid hard-coding the dataset's slug and enable a run on different or multiple datasets.
More information about parameters can be found here.
# Tracking and Visualizing
The cnvrg platform is designed to make tracking and visualizing experiments as intuitive as possible. Using either feature allows users to easily sort, search, and compare experiments, enabling detailed comparison between experiments and models.
The cnvrg Research Assistant automatically extracts parameters, metadata, and model performance, automatically creating tags and useful charts from experiments with no activation needed. The Research Assistant works with applications such as scikit-learn, Keras, TensorFlow, and Caffe.
Experiment tracking can be customized in two ways:
- Set print statements to Standard Output to track selected parameters or create custom charts
- Customize tracking using the Python SDK
# Log a metric or parameter as a tag
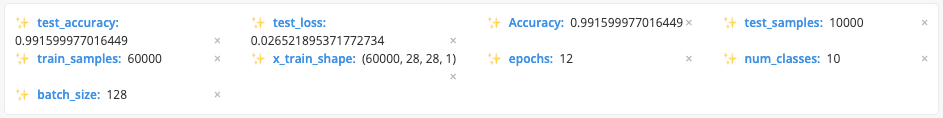
Users can take any information, extract it as a metric, and create a tag for an experiment that is used for sorting, searching, and comparing.
Log Parsing
Print to Standard Output:
"cnvrg_tag_key: value"For example, if you print
cnvrg_tag_precision: 0.9, the Research Assistant automatically transforms it to a tag namedprecisionwith a value of 0.9.Python SDK
Use the
log_parammethod to track custom metrics and parameters:from cnvrg import Experiment e = Experiment() e.log_param("key", "value")For example,
e.log_param("precision", "0.9")creates a tag namedprecisionwith value of 0.9.
# Create a line chart
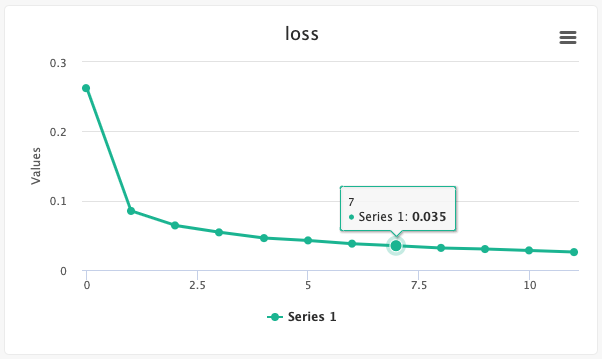
Users can create single- and multiple-line charts to track any variable changes throughout an experiment's run. This is useful for tracking metrics like accuracy or loss as developed during model creation.
Log Parsing
There are two formats for creating line charts. Using any of the print statements either creates a new graph or augments an existing same-named graph.
Name, Value:
Print to Standard Output:
"cnvrg_linechart_Name value: Value"For example, if you print
"cnvrg_linechart_computingPie value: 3.14", cnvrg creates a graph titled computingPie (or adds to an already existing graph), and adds a data point with value 3.14.Name, Group, Value:
Print to Standard Output:
"cnvrg_linechart_Name group: "Group_name" value: Value"For example, if you print
"cnvrg_linechart_computingPie group: "pi_val" value: 3.14", cnvrg creates a graph titled computingPie (or adds to an already existing graph), as well as adds a data point with a 3.14 value and a pi_val labeled line. Use this format to add multiple lines to one graph.
TIP
Use this format to quickly create the correct format in Python using variables:
cnvrg_linechart_{} value: '{}'\n".format(chart_name, value)Python SDK
Use the
log_metric()method to create single-line and multi-line charts.from cnvrg import Experiment e = Experiment() e.log_metric("chart_title", Ys=[val_1,val_2,val_3])For example,
e.log_metric("accuracy", ys=[0.6,0.64,0.69])creates a chart named accuracy with three data points: (0,0.6), (1,0.64), and (2,0.69).For more information on creating single-line or multi-line charts with the Python SDK, see the cnvrg SDK documentation.
# Create a confusion matrix/heatmap
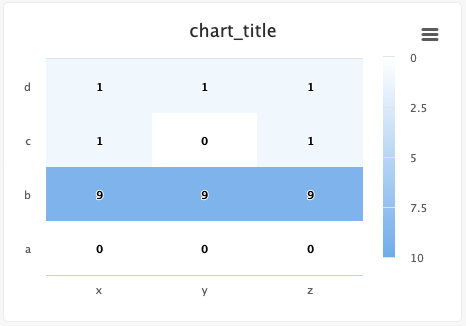
Users can easily create confusion matrices and heatmaps using the Python SDK.
Python SDK
from cnvrg import Experiment
from cnvrg.charts import MatrixHeatmap
e = Experiment()
e.log_chart(key="chart_key", title="chart_title", group=None, step=None, x_ticks=['x', 'y', 'z'], y_ticks=['a', 'b', 'c', 'd'],
    data=MatrixHeatmap(matrix=[(0,0,0), (9,9,9), (1,0,1), (1,1,1)],
                       color_stops=[[0,'#000000'],[1, '#7EB4EB']],
                       min_val=0,
                       max_val=10))
Use the following guidelines to enter information:
x_ticksandy_ticksis a list(x,y,z)struct forms a list of matrix tuplescolor_stops(optional) is a list of lists with size two, where the nested first value is a float 0 <= X <= 1 value and the second value is the color hex value to represent matrix values at that point of the scalemin_valandmax_val(optional) are numbers corresponding to the key's minimum and maximum values (cnvrg scales automatically when these values are not submitted)
Each struct corresponds to a row in the matrix and to a label from the
y_tickslist. The matrix is built from the bottom up, with the first struct and y_tick at the bottom edge. Each value inside the struct corresponds to each x_tick.Steps and groups
Steps and groups allow users to create heatmaps across different steps and incorporate them in a single chart with a slider to move between the steps.
stepsis an integer andgroupis a string. Group multiplestepswithin a singlegroup.
for i in range(10):
  e.log_chart(key="MyChart_" + str(i), group="group-1", step=i, title="MyChart_" + str(i),
  x_ticks=['x', 'y', 'z'],
  y_ticks=['a', 'b', 'c', 'd'],
  data=MatrixHeatmap(matrix=[(0,0,0), (9,9,i), (i,0,1), (1,i,1)],
  min_val=0, max_val=10))
TIP
When using the group parameter, ensure the chart's key is unique across the different steps.
For more information on creating confusion matrices with the Python SDK, see the cnvrg SDK documentation.
# Create a bar graph
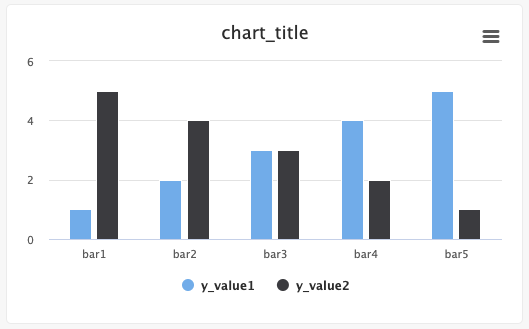
Users can create single-bar and multi-bar graphs using the Python SDK.
Python SDK
from cnvrg import Experiment
from cnvrg.charts import Bar
e = Experiment()
x_value=["bar1","bar2","bar3","bar4","bar5"]
y_value1=[1,2,3,4,5]
y_value2=[5,4,3,2,1]
e.log_chart("chart_key", title="chart_title", group=None, step=None,
    data=[Bar(x=x_value, y=y_value1, name="y_value1", min_val=0, max_val=10)),
          Bar(x=x_value, y=y_value2, name="y_value2")])
Use the following guidelines to enter information:
xis aList; thexlist populates the bar labelsyis anarray,np.ndarry,pd.arrayorpd.series; theyvalue (corresponding to thex) dictates that category's bar value, with itsyarray name being the title of the graph's set/categorymin_valandmax_val(optional) for each bar correspond to the key's minimum and maximum values (cnvrg scales automatically when these values are not submitted)
Steps and groups
Steps and groups allow users to submit bar charts across different steps and incorporate them in a single chart with a slider to move between the steps.
stepsis an integer andgroupis a string. Group multiplestepswithin a singlegroup.
for i in range(10):
  e.log_chart(key="MyChart" + str(i), group="group-1", step=i, title="MyChart",
      data=[Bar(x=["cat1", "cat2", "cat3"], y=[1**1, 2/(i+1), 3*i], name="Bar1"),
            Bar(x=["cat1", "cat2", "cat3"], y=[2**1, 3/(i+1), 4*i], name="Bar2")])
TIP
When using the group parameter, ensure the chart's key is unique across the different steps
For more information on creating bar graphs with the Python SDK, see the cnvrg SDK documentation.
# Create a scatter plot
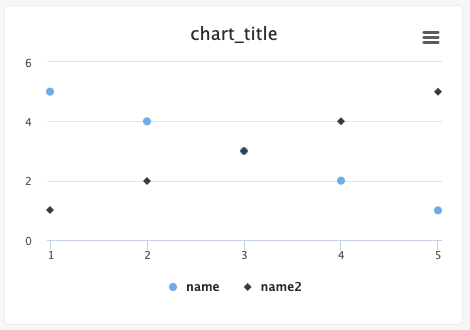
Users can create scatter plots using the Python SDK.
Python SDK
from cnvrg import Experiment
from cnvrg.charts import Scatterplot
e=Experiment()
x1_values=[1,2,3,4,5]
x2_values=[1,2,3,4,5]
y1_values=[5,4,3,2,1]
y2_values=[1,2,3,4,5]
e.log_chart("chart_key", title="chart_title",
data=[Scatterplot(x=x1_values, y=y1_values, name="name"),
      Scatterplot(x=x2_values, y=y2_values, name="name2")])
Use the following guidelines to enter information:
xandyare anArray,np.ndarry,pd.arrayorpd.seriesxis the list of x values andyis the list of y values
For more information on creating scatter graphs with the Python SDK, see the cnvrg SDK documentation.
# Change the title of an experiment
Users can easily change an experiment's name. An experiment can include variables or any string in label. One example of using this tag is when running a grid search and using the parameters to name the experiment. Doing so allows users to easily mark the parameters tested in the specific experiment.
Log Parsing
Print to Standard Output:
"cnvrg_experiment_title: experiment_title"For example, print
cnvrg_experiment_title: "New Name"renames the experiment New Name.Python SDK
from cnvrg import Experiment
e = Experiment()
e.title = "experiment_title"
For example, the script
e.title = "New Name"changes the experiment name to New Name.
# Running Grid Searches and Optimizing Hyperparameters
A grid search is the process of selecting a set of parameters for a learning algorithm, usually with the goal of optimizing a measure of the algorithm's performance on an independent dataset.
With cnvrg, a user can run multiple experiments in parallel using a single command, which is useful for grid searches and hyperparameter optimization.
There are two ways of triggering grid searches in cnvrg:
# Using the UI
To run a grid search using the UI, navigate to the Experiments tab of your project and click New Experiment.
On the displayed New Experiment page, click the Parameters tab arrow to expand its section. In this section, adjust the parameters to tune.

Click Add to add another parameter.
TIP
More information on using this menu can be found here.
Click Run to automatically run an experiment for each permutation of the parameters included.
# Using the CLI
To run a grid search using the CLI, first create a YAML file that contains information about the parameters and their possible values.
In the YAML file, each parameter has a param_name that should match its argument fed to the experiment.
To trigger the grid search, use the following command:
cnvrg run --grid=src/hyper.yaml python myscript.py
The following code provides an example YAML hyper.yaml file:
parameters:
    - param_name: "learning_rate"
      type: "discrete"
      values: [0.1, 0.01 ,0.001]

    - param_name: "kernel"
      type: "categorical"
      values: ["linear", "rbf"]

    - param_name: "epochs"
      type: "integer"
      min: 10 # inclusive
      max: 200 # not inclusive
      scale: "linear"
      steps: 10 # The number of linear steps to produce.

    - param_name: "fractions"
      type: "float"
      min: 0.1 # inclusive
      max: 0.2 # not inclusive
      scale: "log2"
      steps: 10 # The number of linear steps to produce.
TIP
The scale can be linear, log2, or log10.
# Using this feature in your code
When running a grid search, the parameters are included as flags on the command line argument that runs the code in the remote compute.
For example, when tuning epochs, use the following command to execute on the remote compute: python3 myscript.py --epochs 10
Then, use an open source library to parse this input and use it as a variable in your code:
argparsefor Python scriptsoptparsefor R code
# Python implementation example
The following example includes a Python snippet that uses argparse library to parse input values from command line:
import argparse

parser = argparse.ArgumentParser(description='set input arguments')

parser.add_argument('--epochs', action="store", dest='epochs', type=int, default=10)
parser.add_argument('--learning_rate', action="store", dest='learning_rate', type=float, default=0.0001)

args = parser.parse_args()

epochs        = args.epochs
learning_rate = args.learning_rate
# R implementation example
The following example includes an R snippet that uses optparse library to parse input values from command line:
install.packages('optparse', dependencies = TRUE)


library("optparse")

option_list = list(
       make_option(c("--epochs"), type="integer",     default=10,help="number of epochs to perform",metavar="number"),
       make_option(c("--learning_rate"), type="double", default=0.001,help="learning rate values",metavar="number"));

opt_parser = OptionParser(option_list=option_list);
opt = parse_args(opt_parser);

#sample printing value

sprintf("Number of epochs is: ( %s )", opt$epochs)
# Producing Experiment Artifacts
Many ML experiments, jobs, and even notebook sessions produce artifacts like models, images, and plots.
In cnvrg, data scientists and developers can easily explore an experiment's artifacts in the job's artifacts section, where they are versioned, stored, and accessed.
A job's artifacts are synced in one of the following ways:
- On manual sync
- By auto-syncing
- Upon experiment completion
To view experiment's artifacts, scroll down below the logs to the Artifacts section:
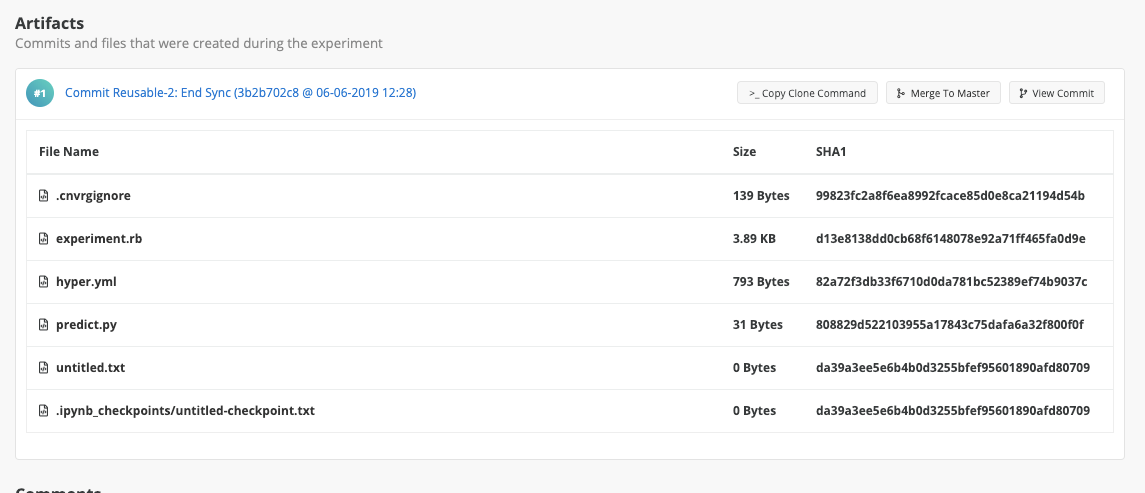
As shown, cnvrg periodically syncs checkpoints from the experiment and adds them to the Experiments page with different commits.
This feature allows users to easily manage all their files because cnvrg associates them with a specific experiment. The experiment's code and its dataset are also versioned. This means a user can easily reproduce the dataset and code that produced the artifacts, allowing work to be accurately tracked and models to be effectively managed.
TIP
You can merge experiment artifact to the master branch by clicking Merge.
# Rerunning Experiments
Reproducible code and environments are key cnvrg elements, which enable the accurate and efficient rerunning of experiments.
To quickly and easily rerun an experiment using all the same settings (such as command, compute, datasets, and Docker image), select an experiment in the experiments table, click the Menu on its right, and then select Rerun from the drop-down list.
The New Experiment page displays with all the details preselected. Check and change details as desired and then run a new instance of the experiment.
# Comparing and Organizing
Understanding an experiment both at-a-glance and in-depth is essential in any data science workflow. The cnvrg platform includes features that enable quick and easy insights into experiments.
A project's Experiments page provides the following options:
- Perform quick operations on experiments
- Customize and sort the experiments table
- Search through experiments
- Compare cnvrg visualization and metadata among experiments
- Compare experiments with TensorBoard
# Perform quick operations on experiments
The Experiments page enables various operations on experiments, which can be performed on a single experiment or on multiple experiments.
# Operations on a single experiment
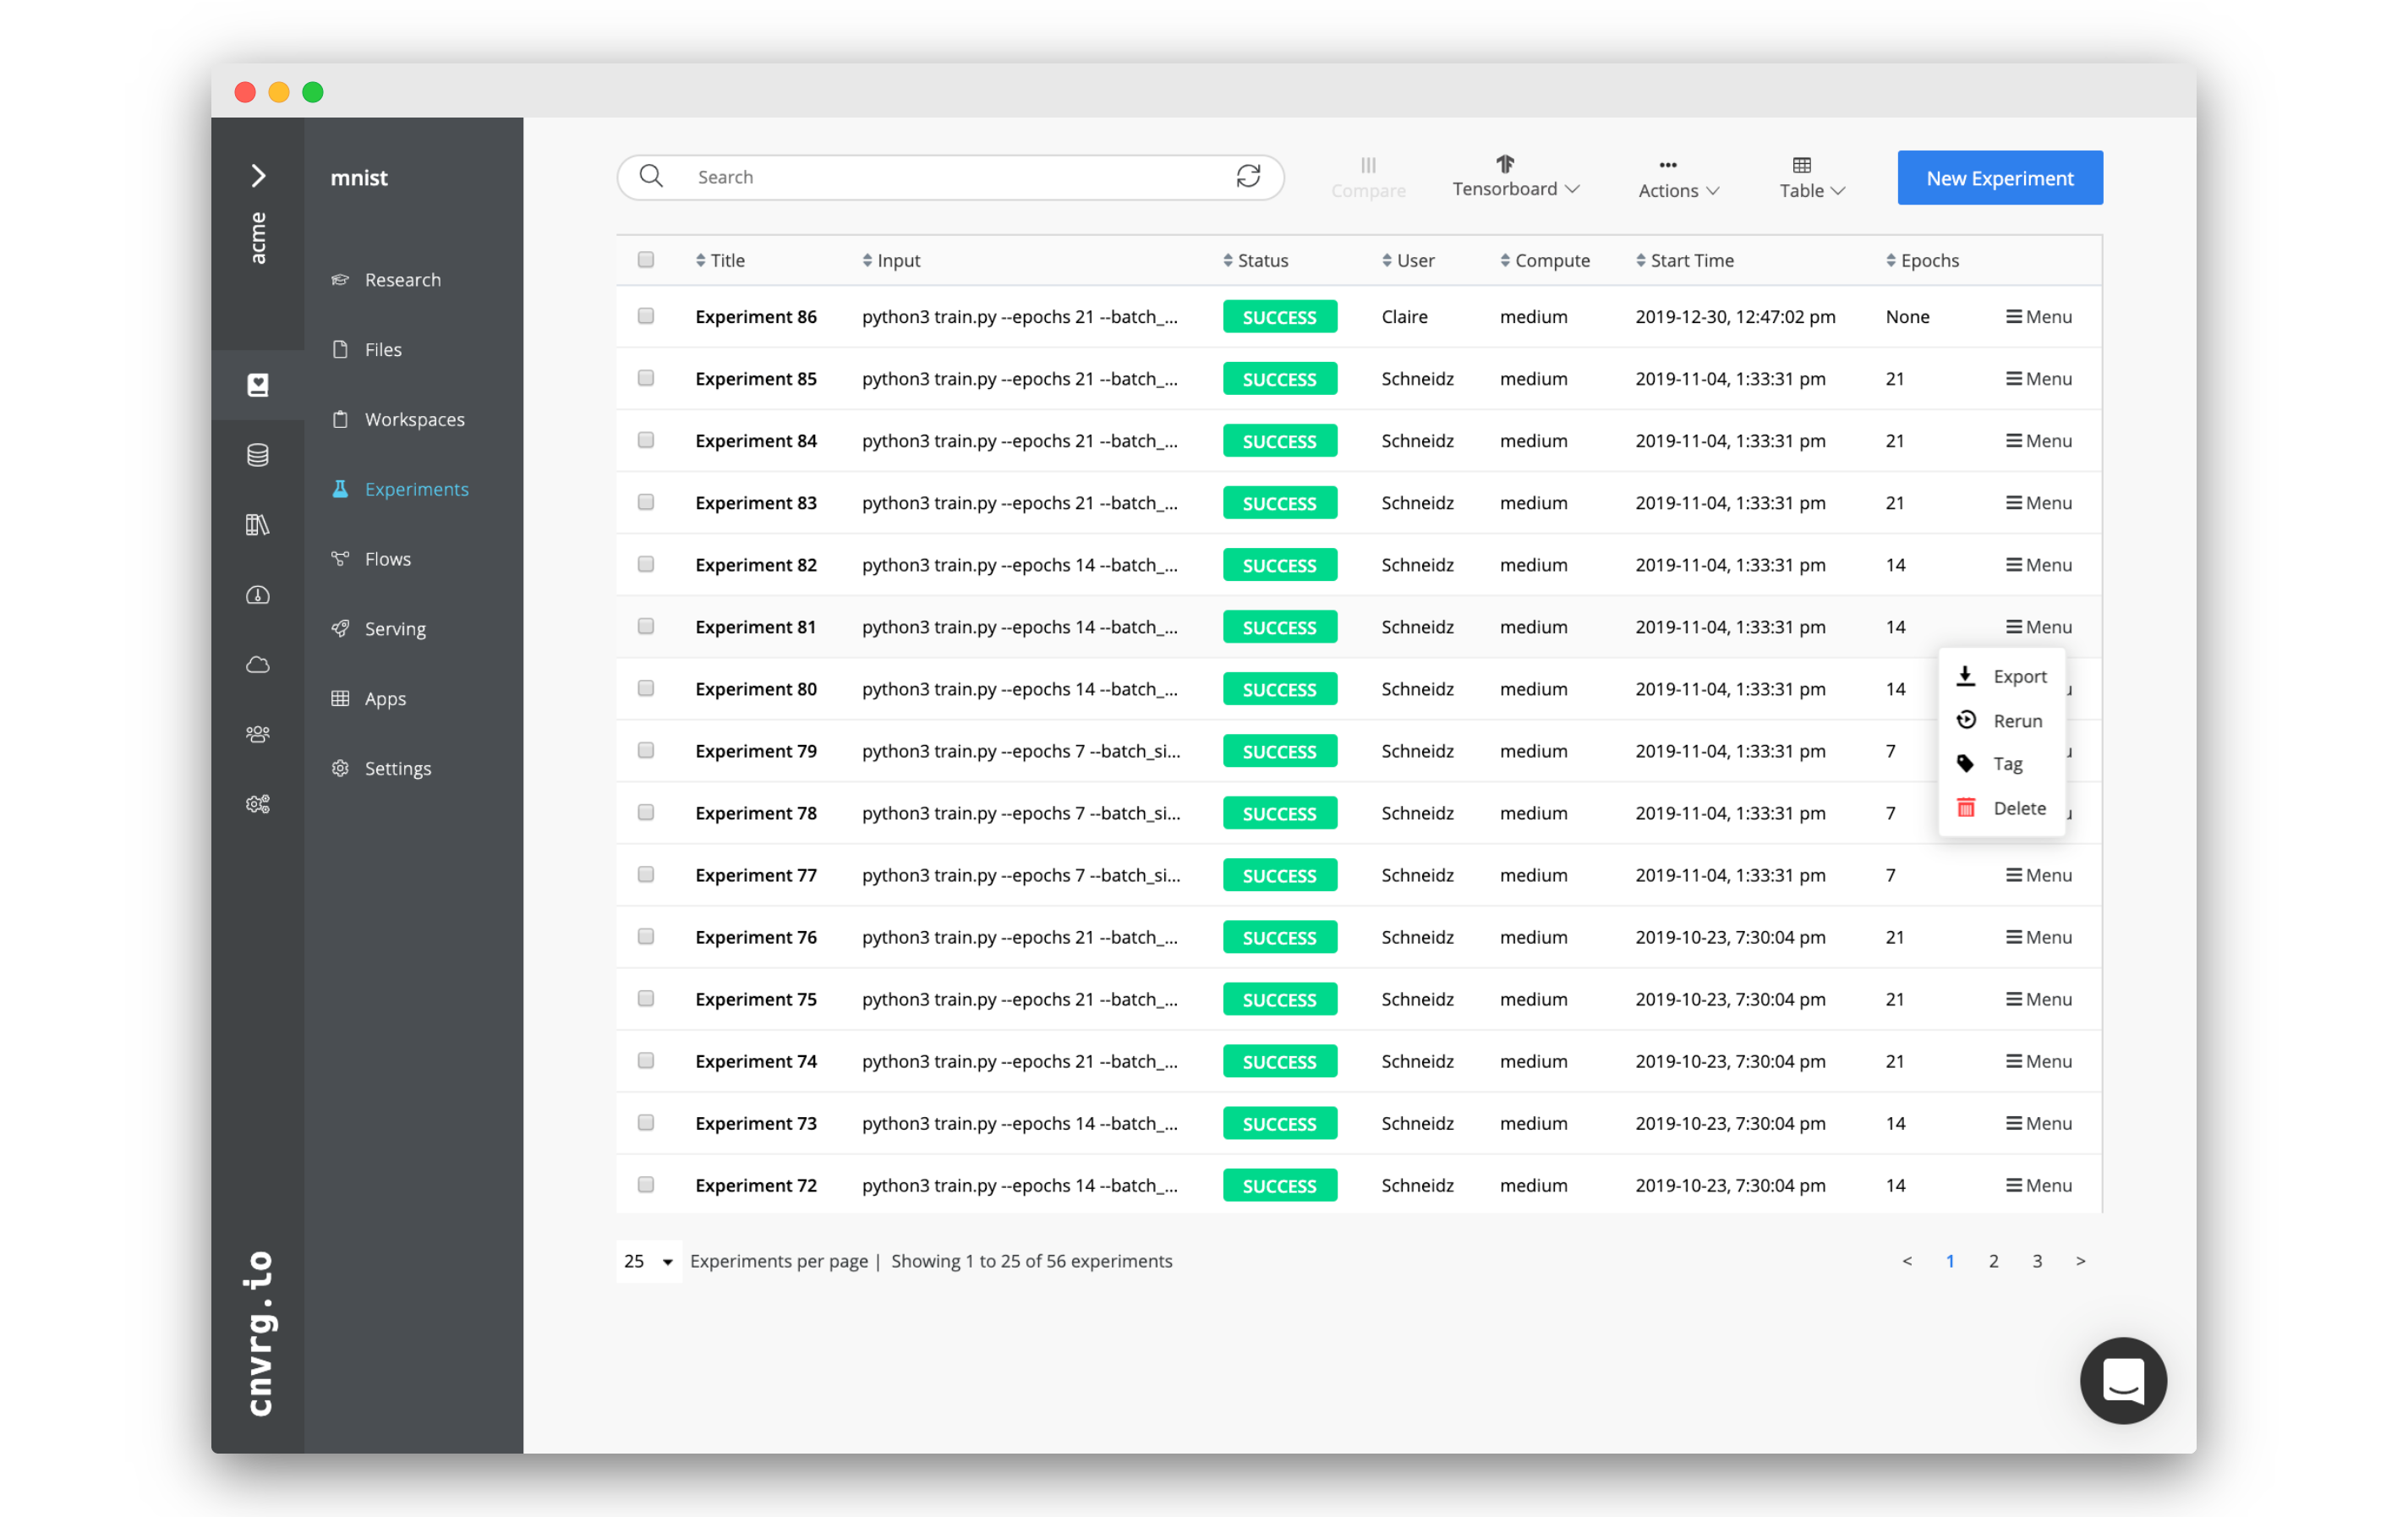
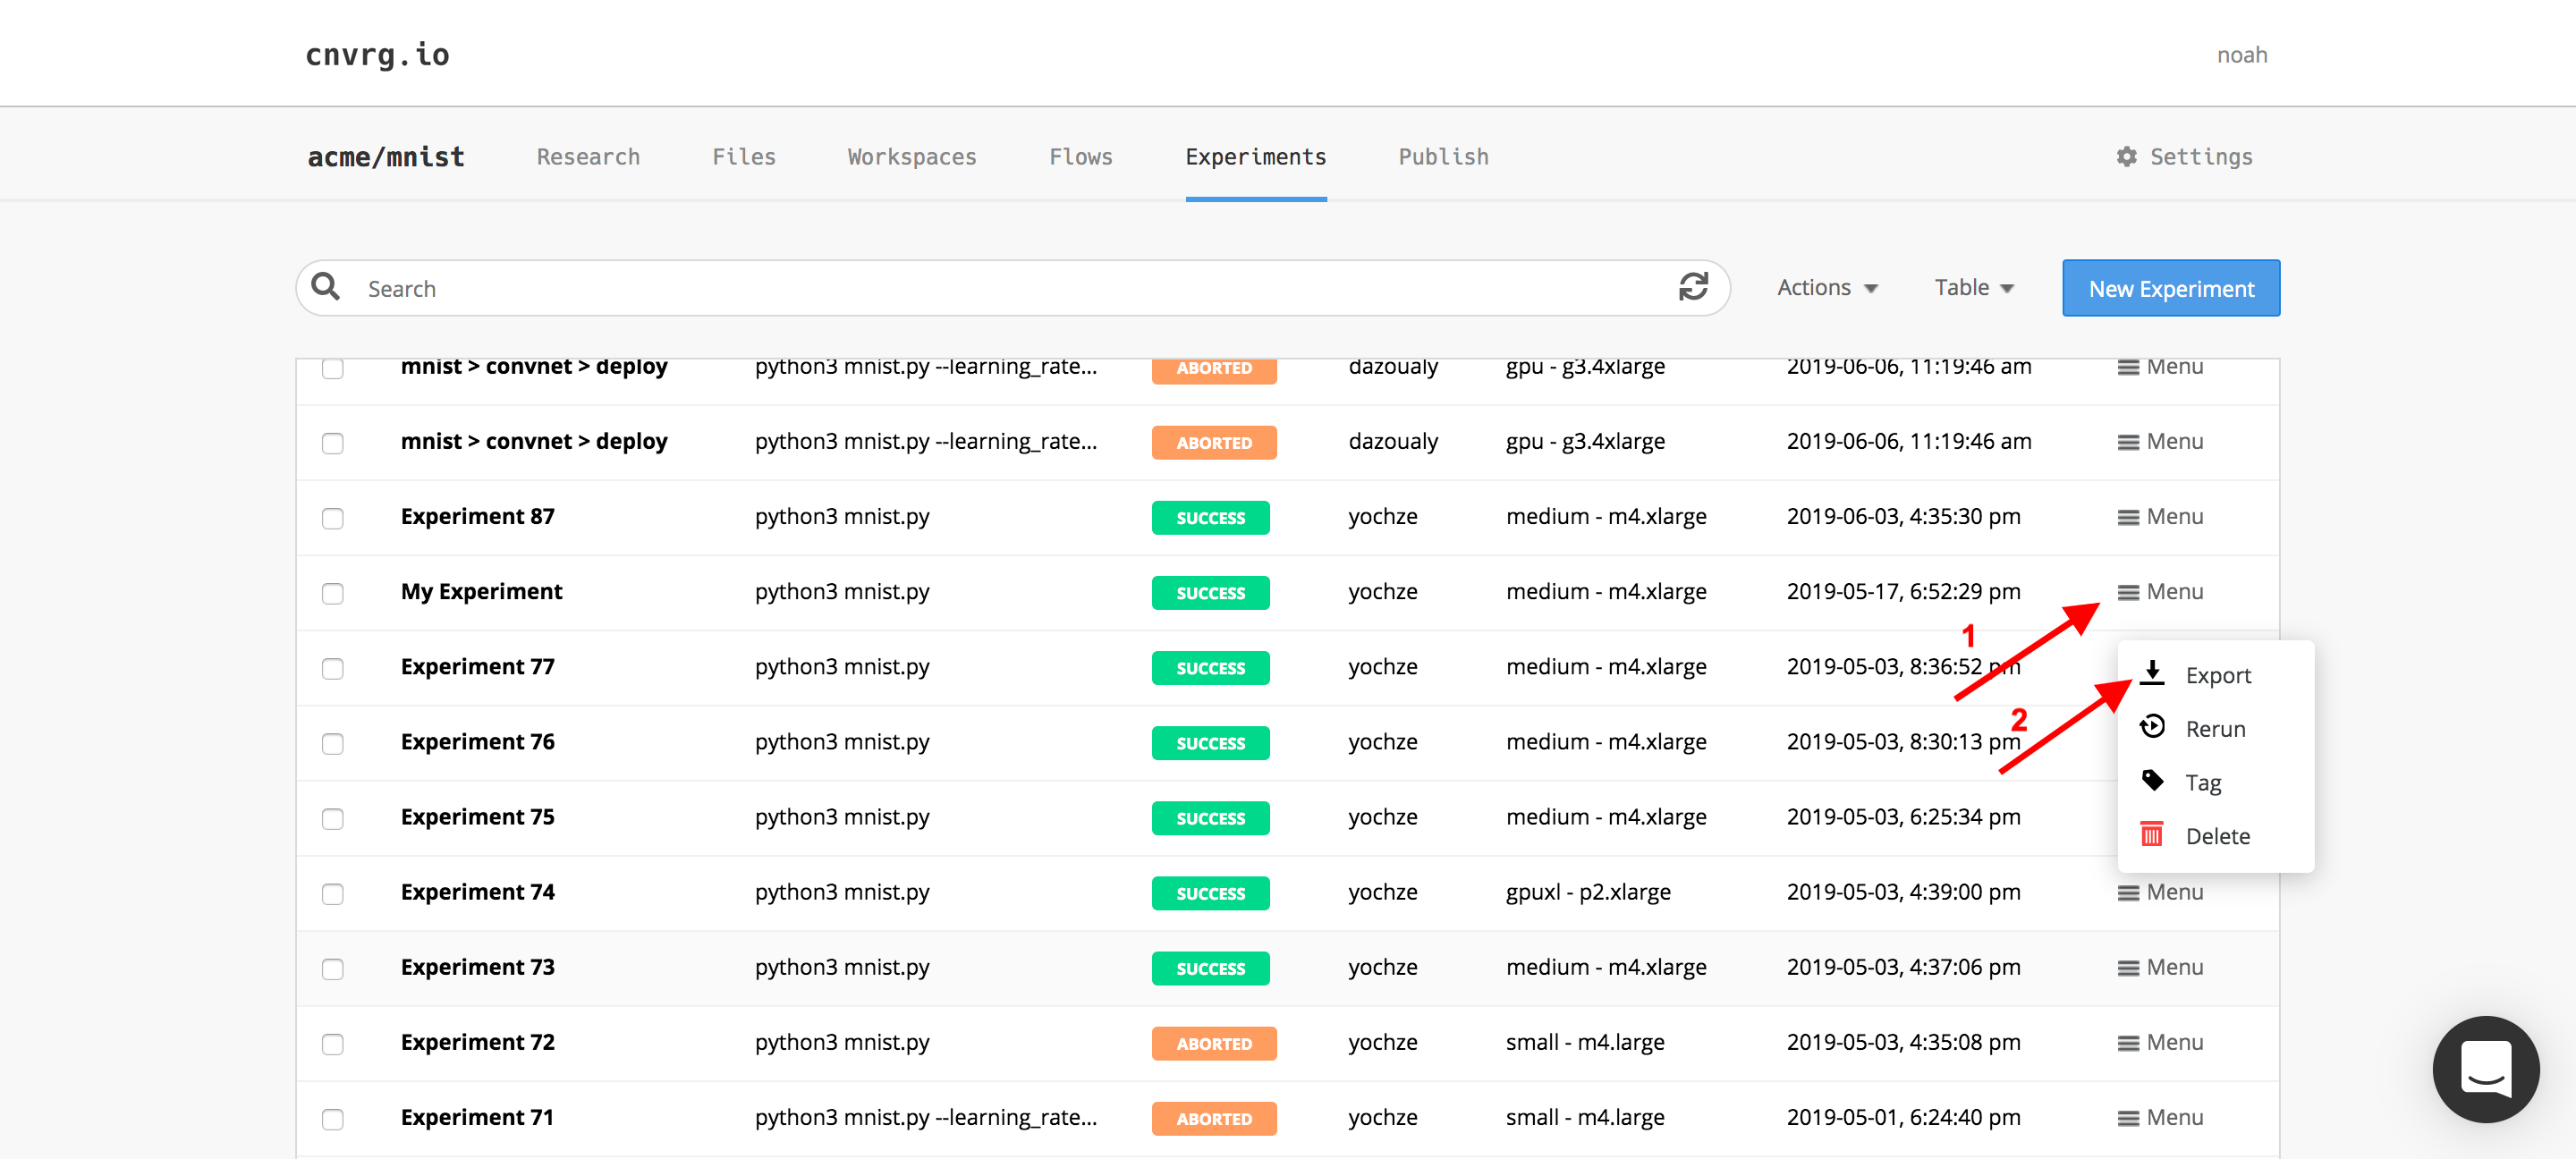
Each row in the experiments table includes a Menu drop-down list on the right end, which provides the following options:
- Stop: Stops the experiment (when running).
- Sync: Syncs the experiment's current artifacts and status with cnvrg (when running).
- Stop & Sync: Syncs the experiment (when running), then stops it.
- Export: Emails the experiment's metadata as a CSV.
- Rerun: Prefills an experiment form with the selected experiment's details.
- Tag: Adds a key-value pair to the experiment's metadata.
- Delete: Deletes the experiment.
# Operations on multiple experiments
Complete the following steps to simultaneously perform actions on multiple experiments:
Check the boxes on the table's left of each experiment to include in the selected action.
TIP
Use the search bar to filter the experiments and quickly find those to select.
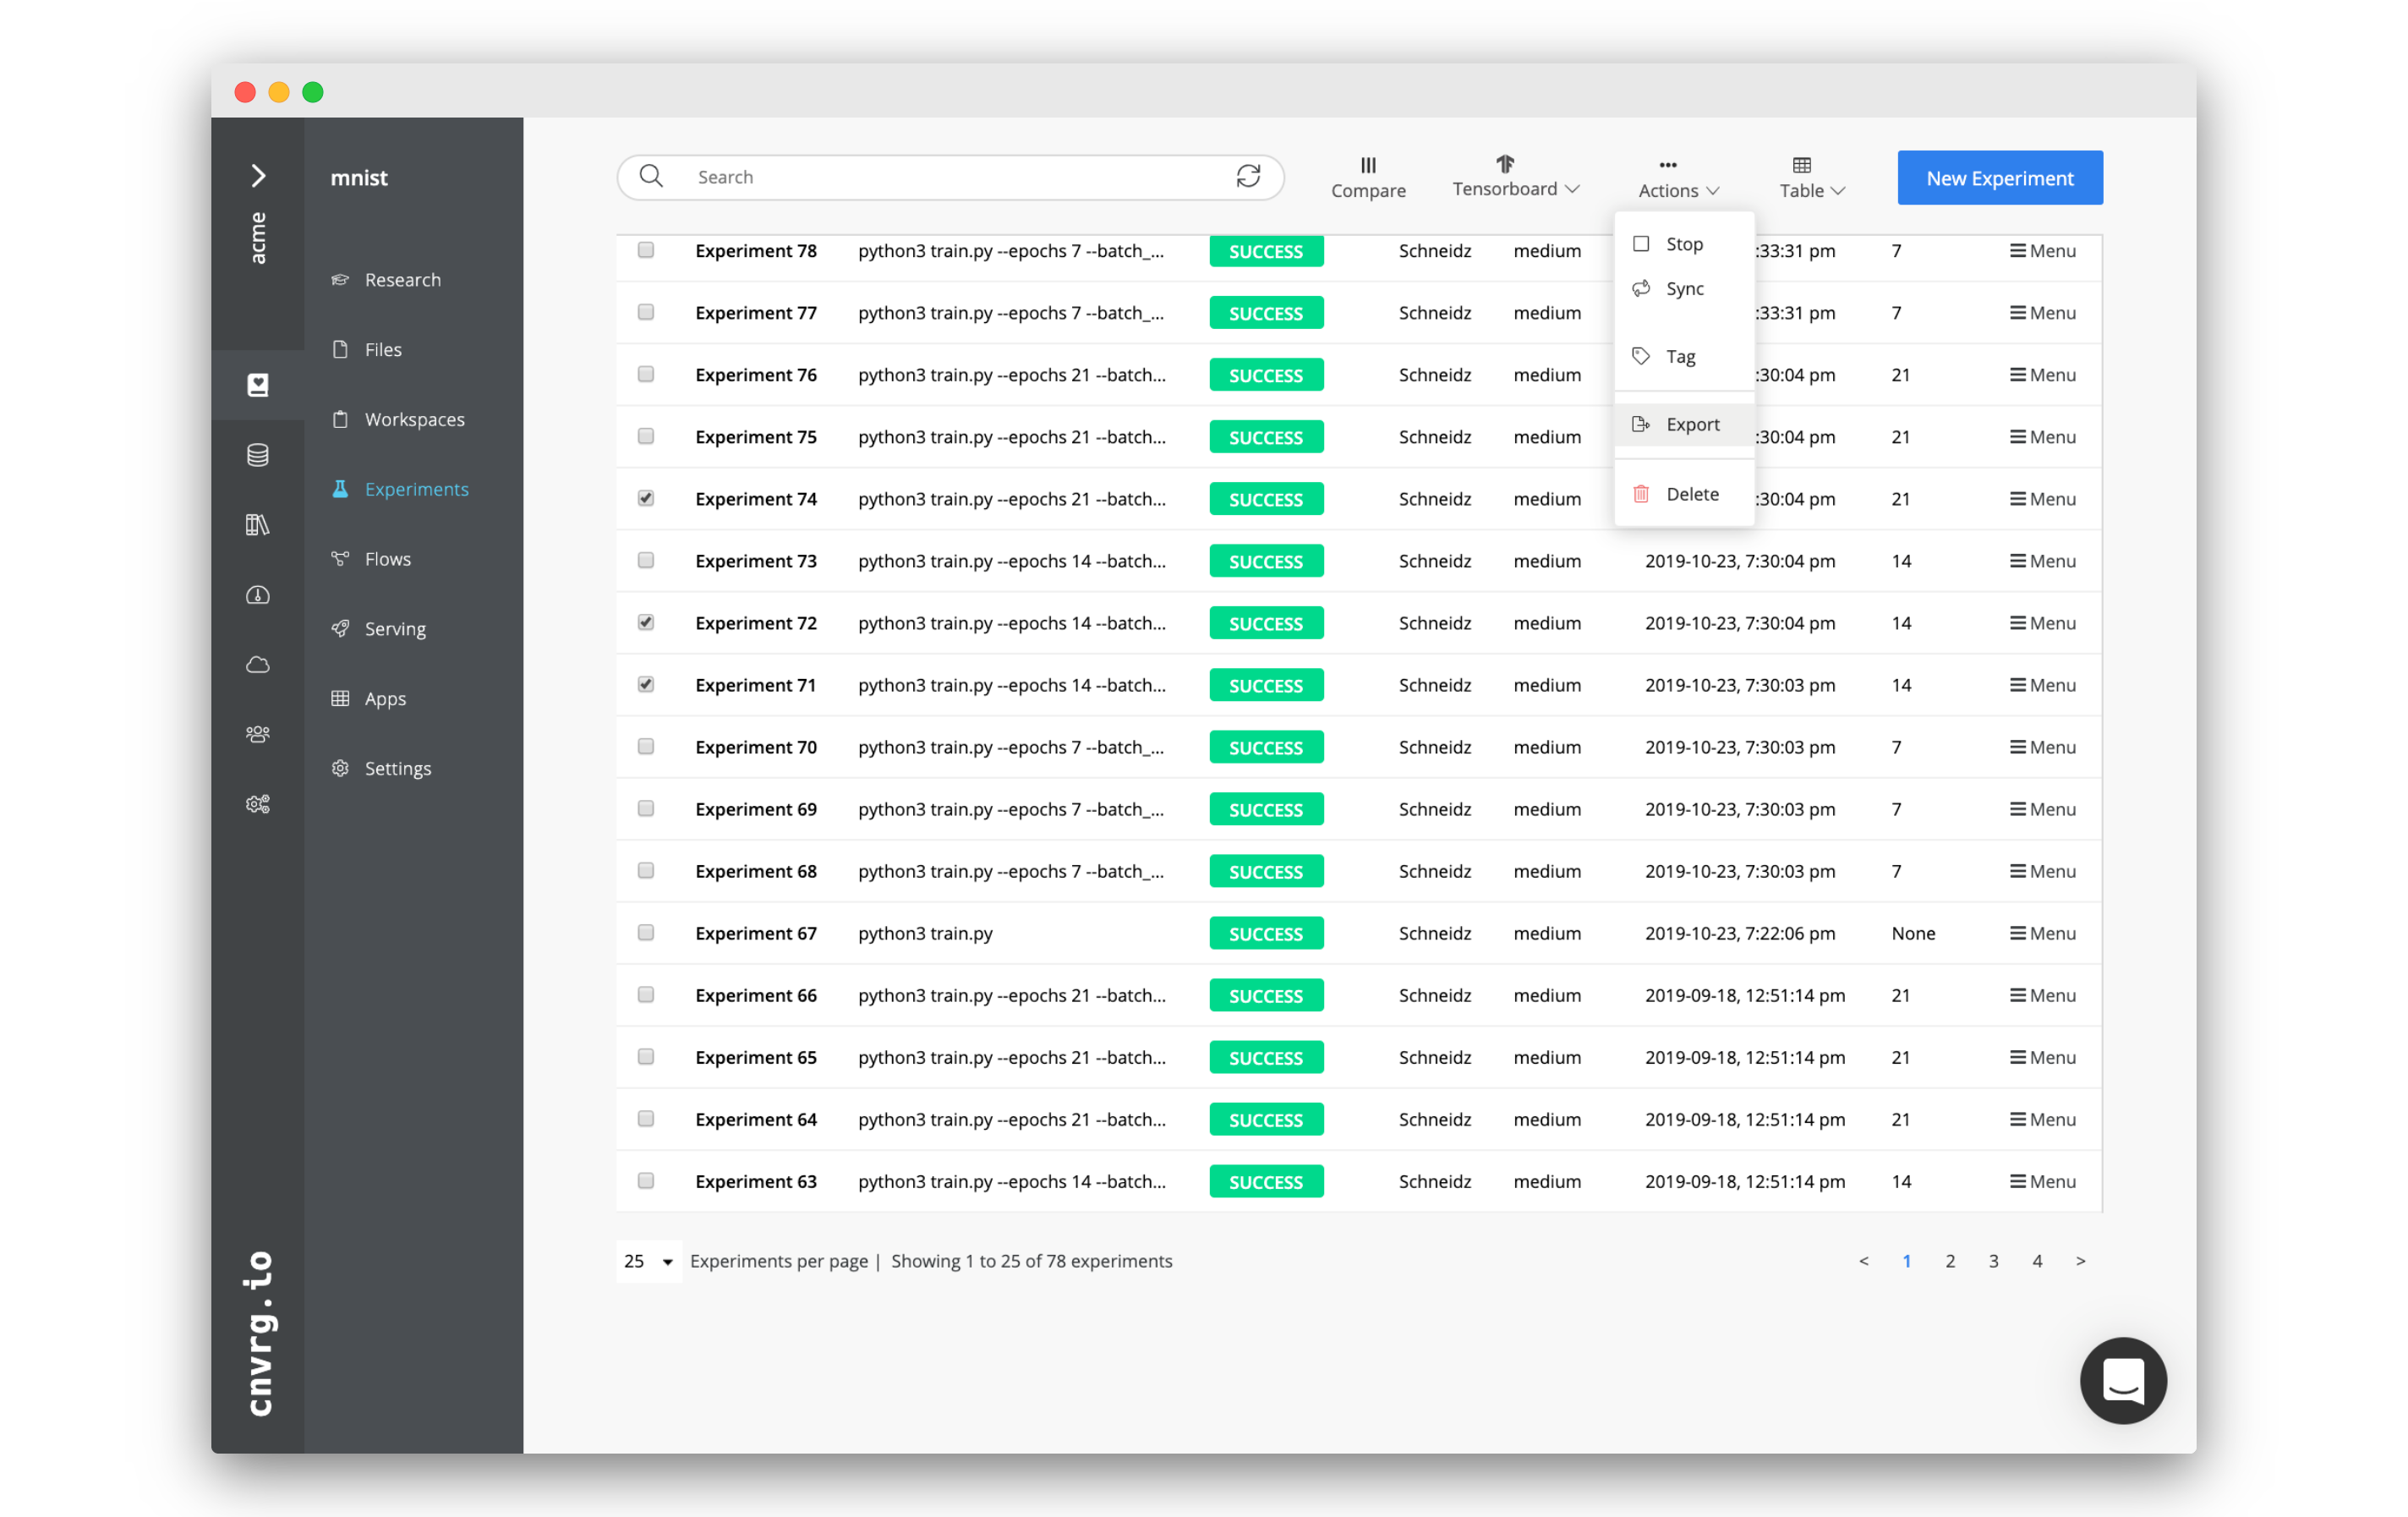
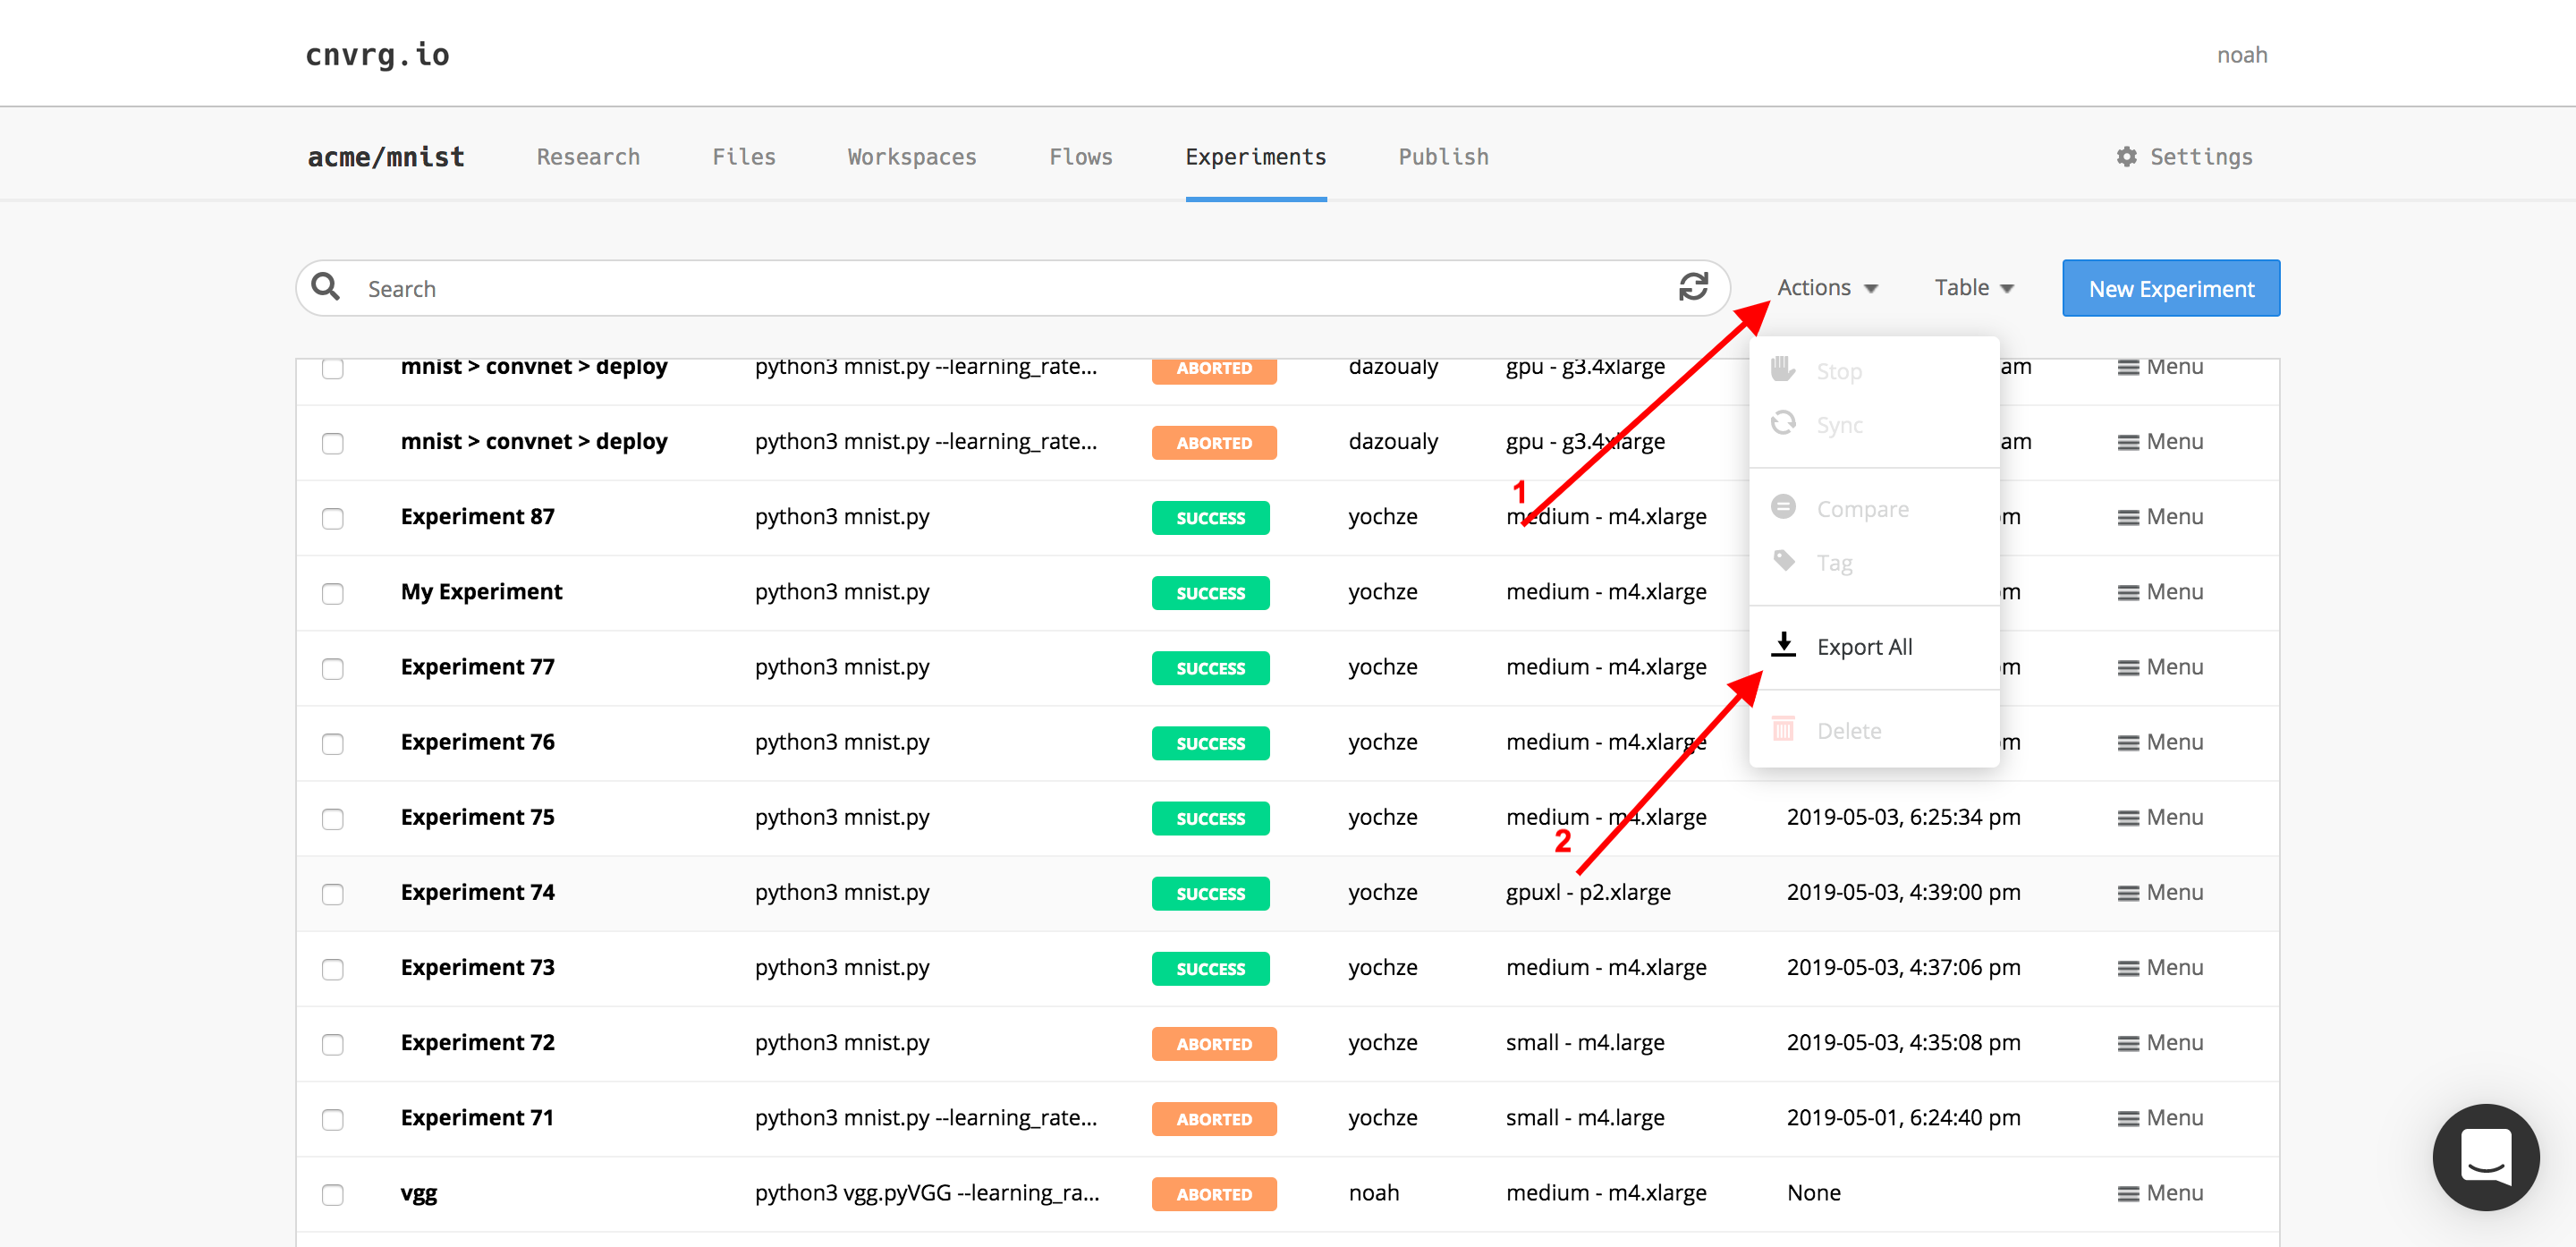
Click the Actions drop-down list at the top of the experiments table and select the desired options:
- Stop: Stops the experiment(s) (when running).
- Sync: Syncs the current artifacts and status of the experiment(s) with cnvrg (when running).
- Tag: Adds a key-value pair to the metadata of the experiment(s).
- Export: Exports the experiment metadata as a CSV.
- Delete: Deletes the experiment(s).
TIP
You can also use this menu when only one experiment is selected.
# Customize and sort the experiments table
A project's Experiments page provides numerous ways to arrange the experiments table for user convenience.
# Display certain columns
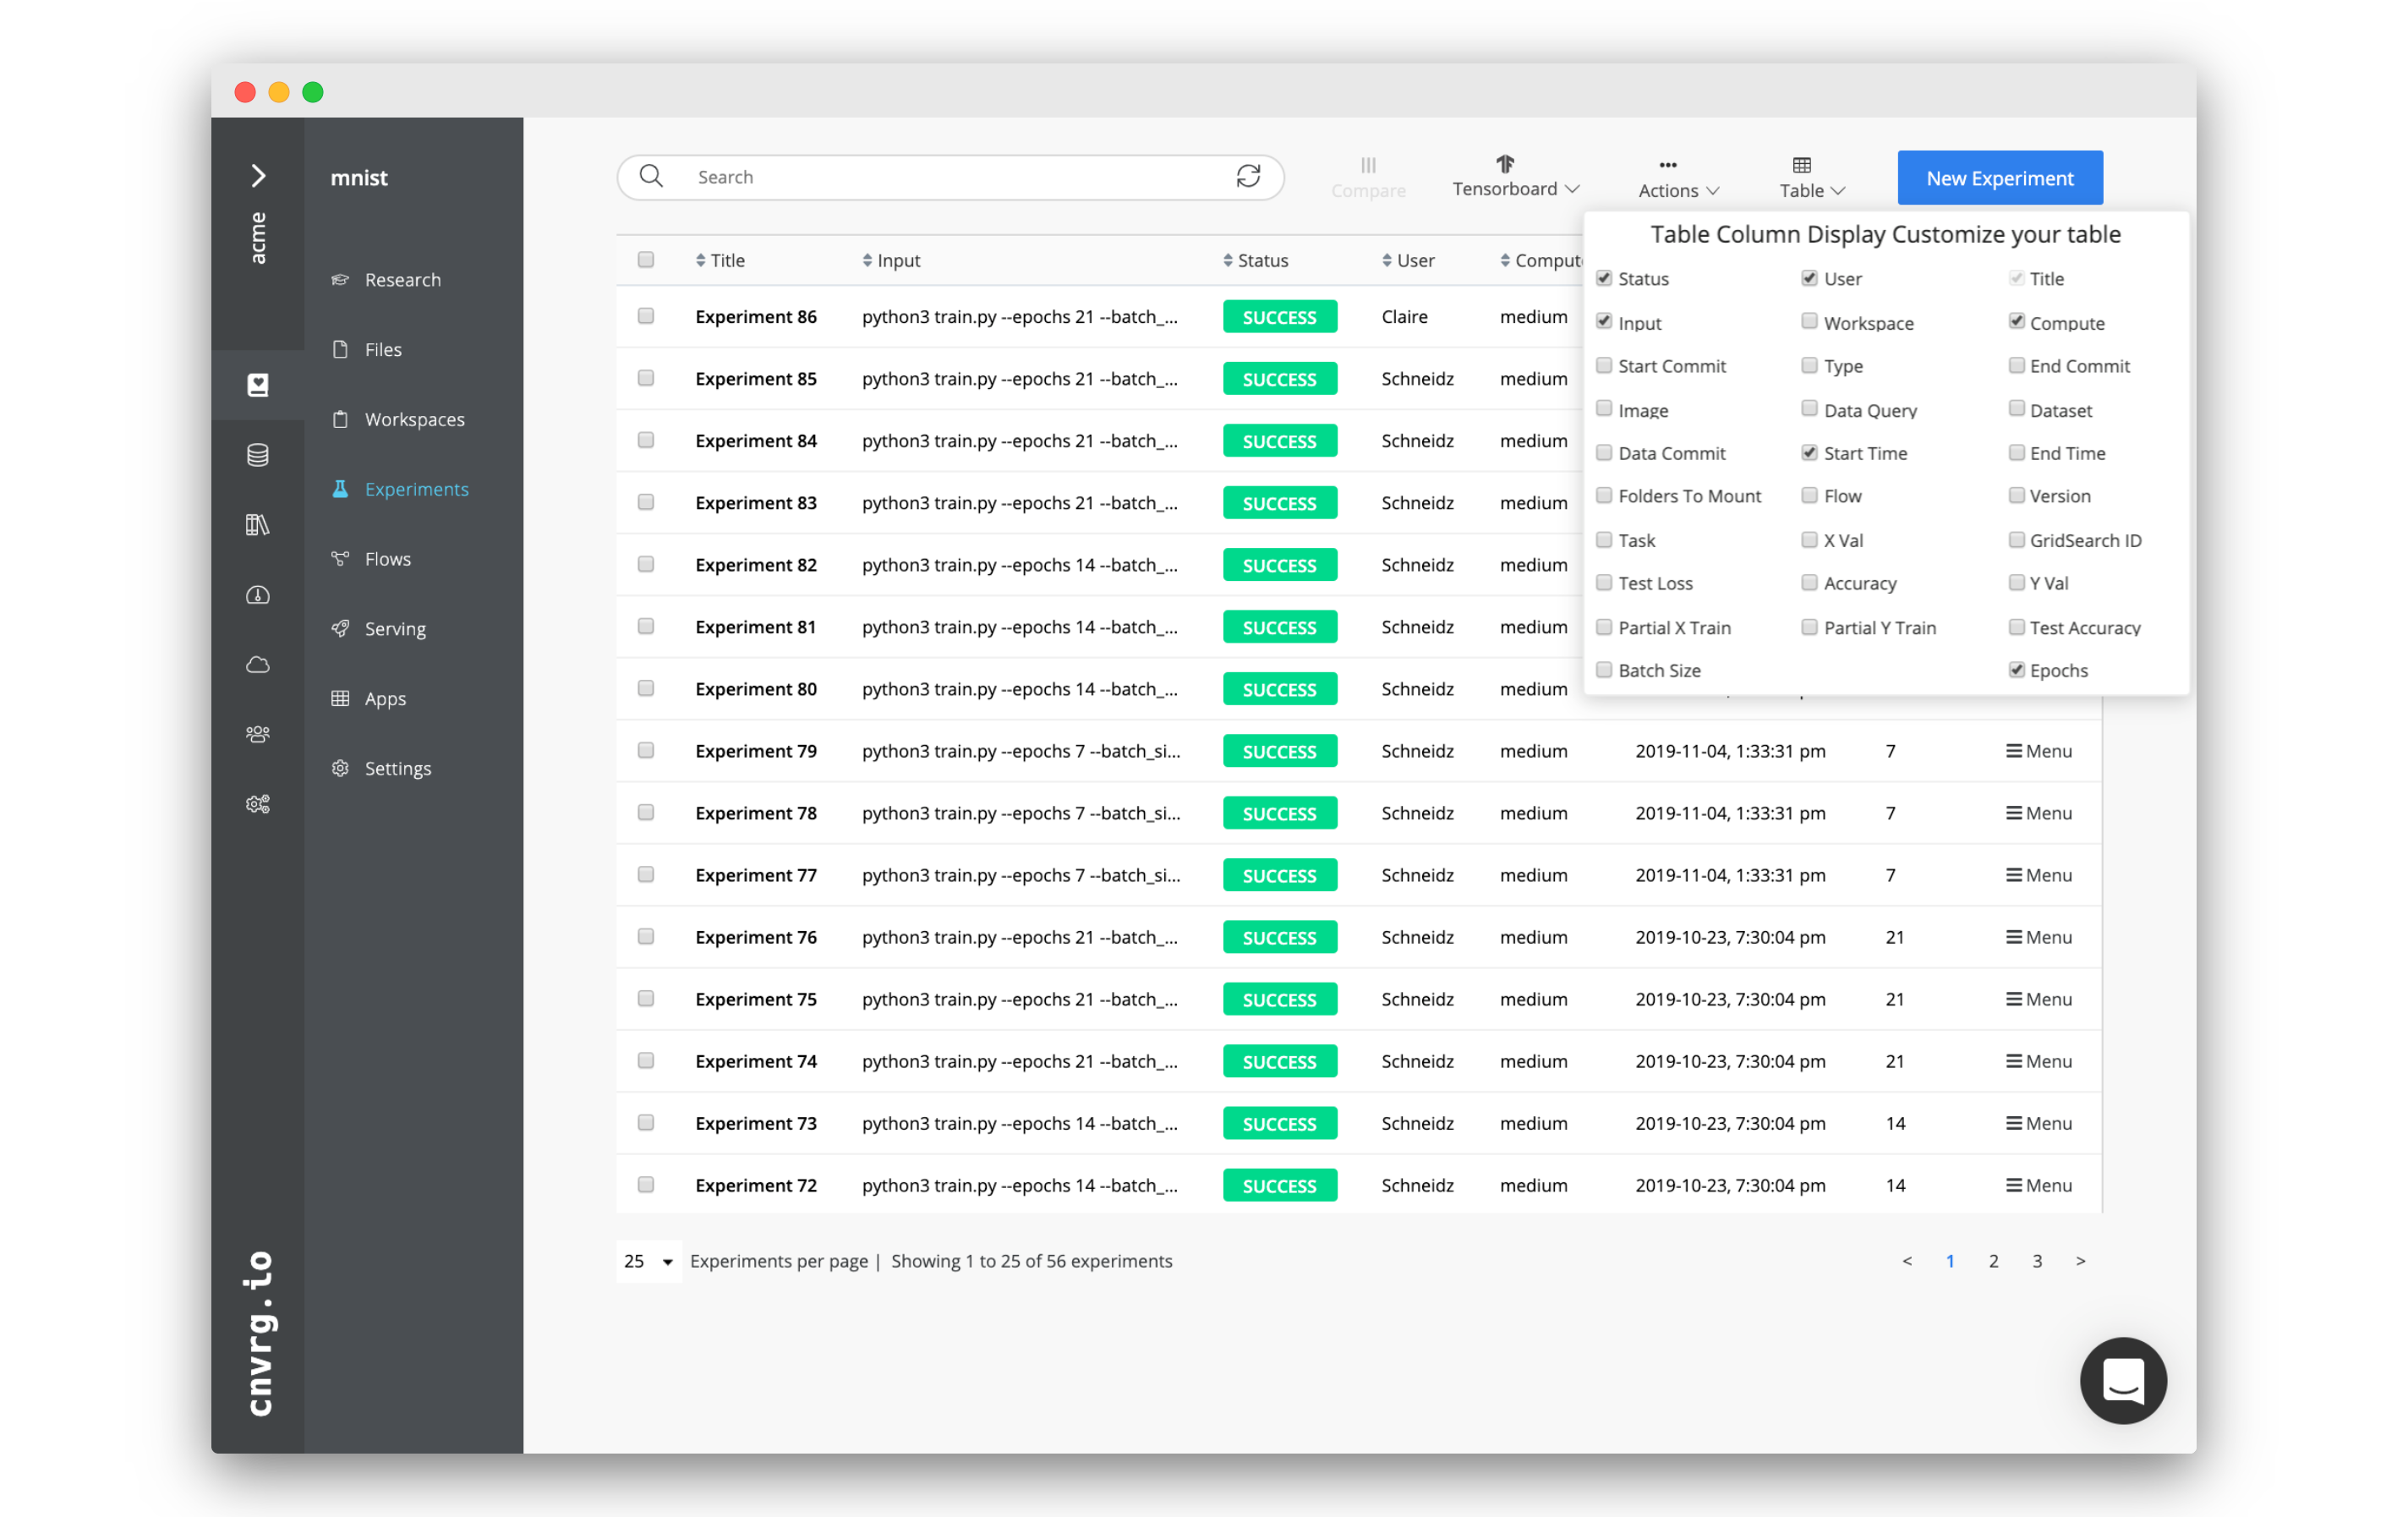
Click the Table drop-down menu to add or remove columns from an experiment.
Inside the menu, click the available columns to either add them to the table (checked) or remove them (unchecked). The table updates immediately.
The list of available columns populates by your experiment metadata. Any tag or parameter, as well as any of the tracked metadata (like start time, commit, and grid search ID), can be used as a column.
# Sort by a column
To sort an experiments table's displayed column, click its title to sort by the values in the selected column. Clicking once sorts in ascending order; clicking twice sorts in descending order. CLicking three times stops sorting by that column.
# Change the number of rows per page
To change the number of displayed rows in the experiments table, click the drop-down list below the table, which shows the number of rows currently visible. In the drop-down list, select to view 10, 25, 50, or 100 experiments at once.
Also, view the number of experiments displayed alongside the total number of experiments in the same place.
# Move between pages of the experiment table
The bottom right of the experiments table provides the ability to jump from page to page. Click the arrows to move one page in either direction or click the number of the specific page desired.
# Search through experiments
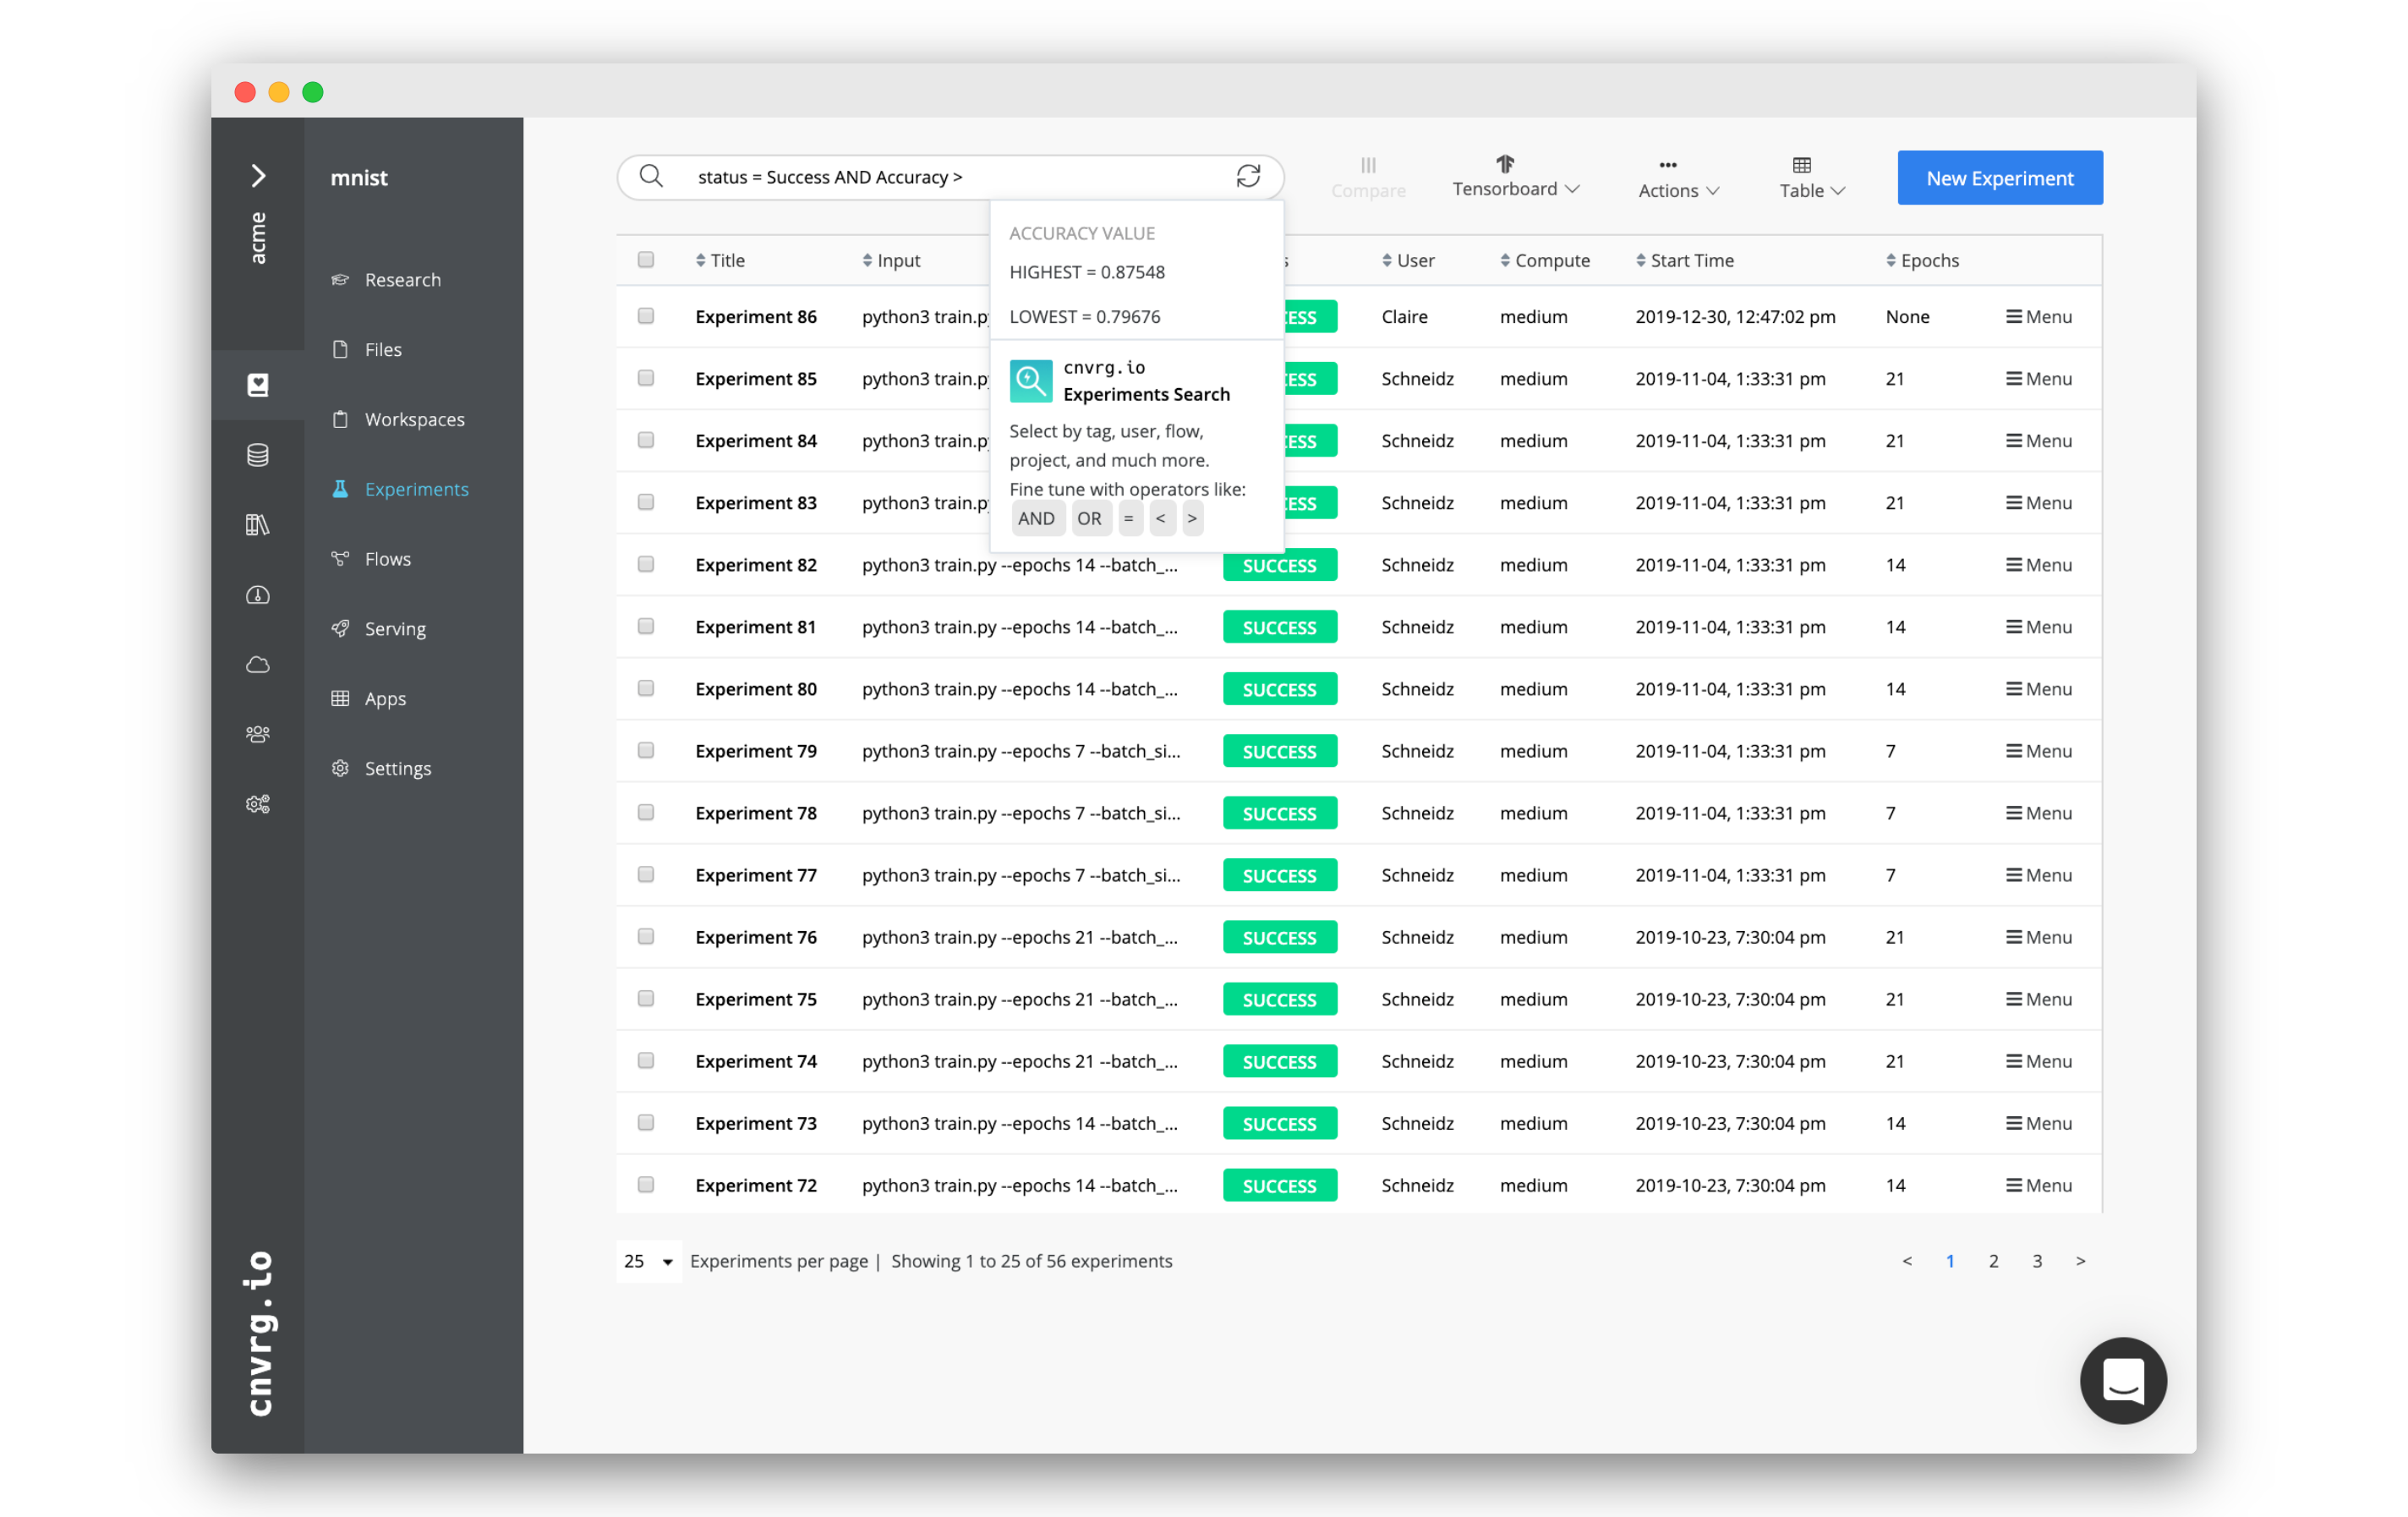
Easily search through experiments using the search bar at the top of the experiments table. Click it to start constructing a search filter.
A search filter is constructed from a category key, category relation, and value:
- A category key can be any of the columns
- A category relation can be any of the operators:
=(equals),>(greater than) or<(less than) - A value can be any string or integer
Also, use a category connect to build more complex filters. A category connect can be either AND or OR.
Press the keyboard [Enter] key or click Search to submit your search criteria and load the matching experiments.
Click the Refresh button in the search bar to reset the experiments table and remove the filter.
For example, the filter status = Success AND Accuracy > 0.85 returns only experiments that have a success status a greater than 0.85 accuracy.
TIP
cnvrg auto-suggests filter terms to help construct filters.
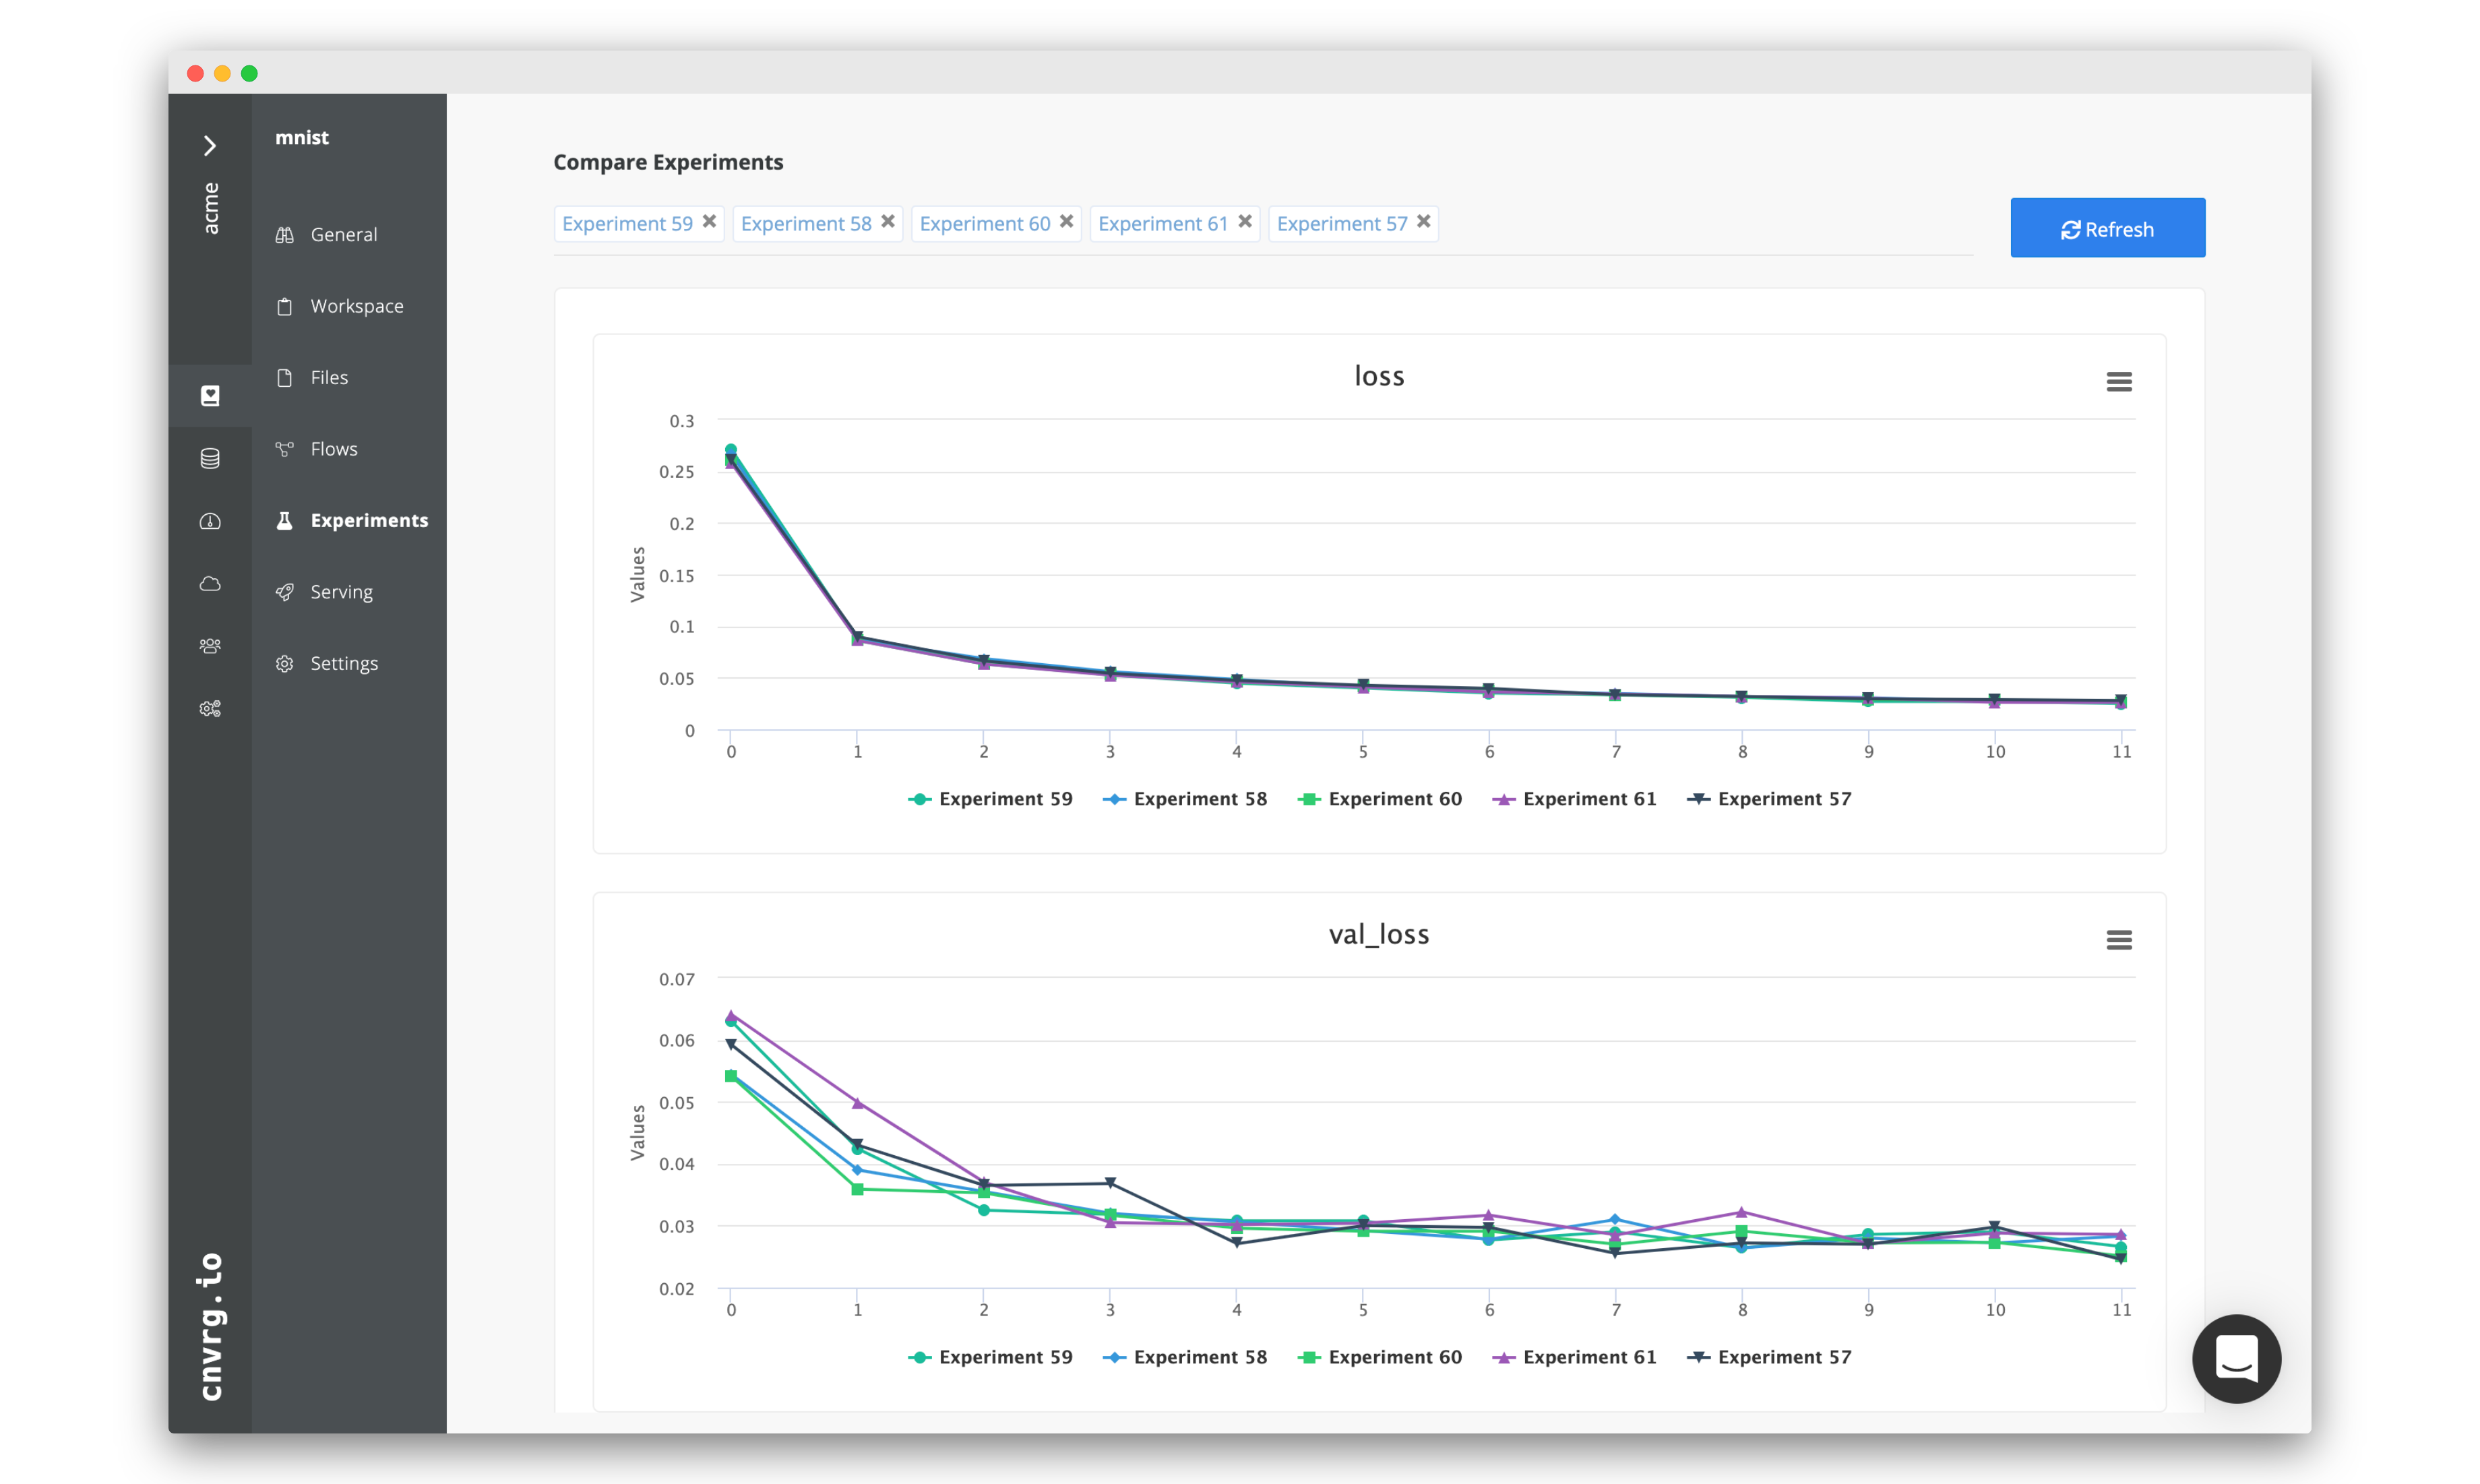
# Compare cnvrg experiment visualization and metadata
The cnvrg platform provides a solution to compare and analyze all experiments and models within a project. Harnessing the cnvrg Research Assistant and all the experiment visualization features (tags and SDK tracking), cnvrg can automatically generate comparisons for all experiments and models.
Complete the following steps to compare experiments:
- Click the Experiments tab of the desired project and navigate to its experiments table.
- Check the boxes on the left side of each experiment to include in the comparison.
- Click Compare at the top of the experiments table.
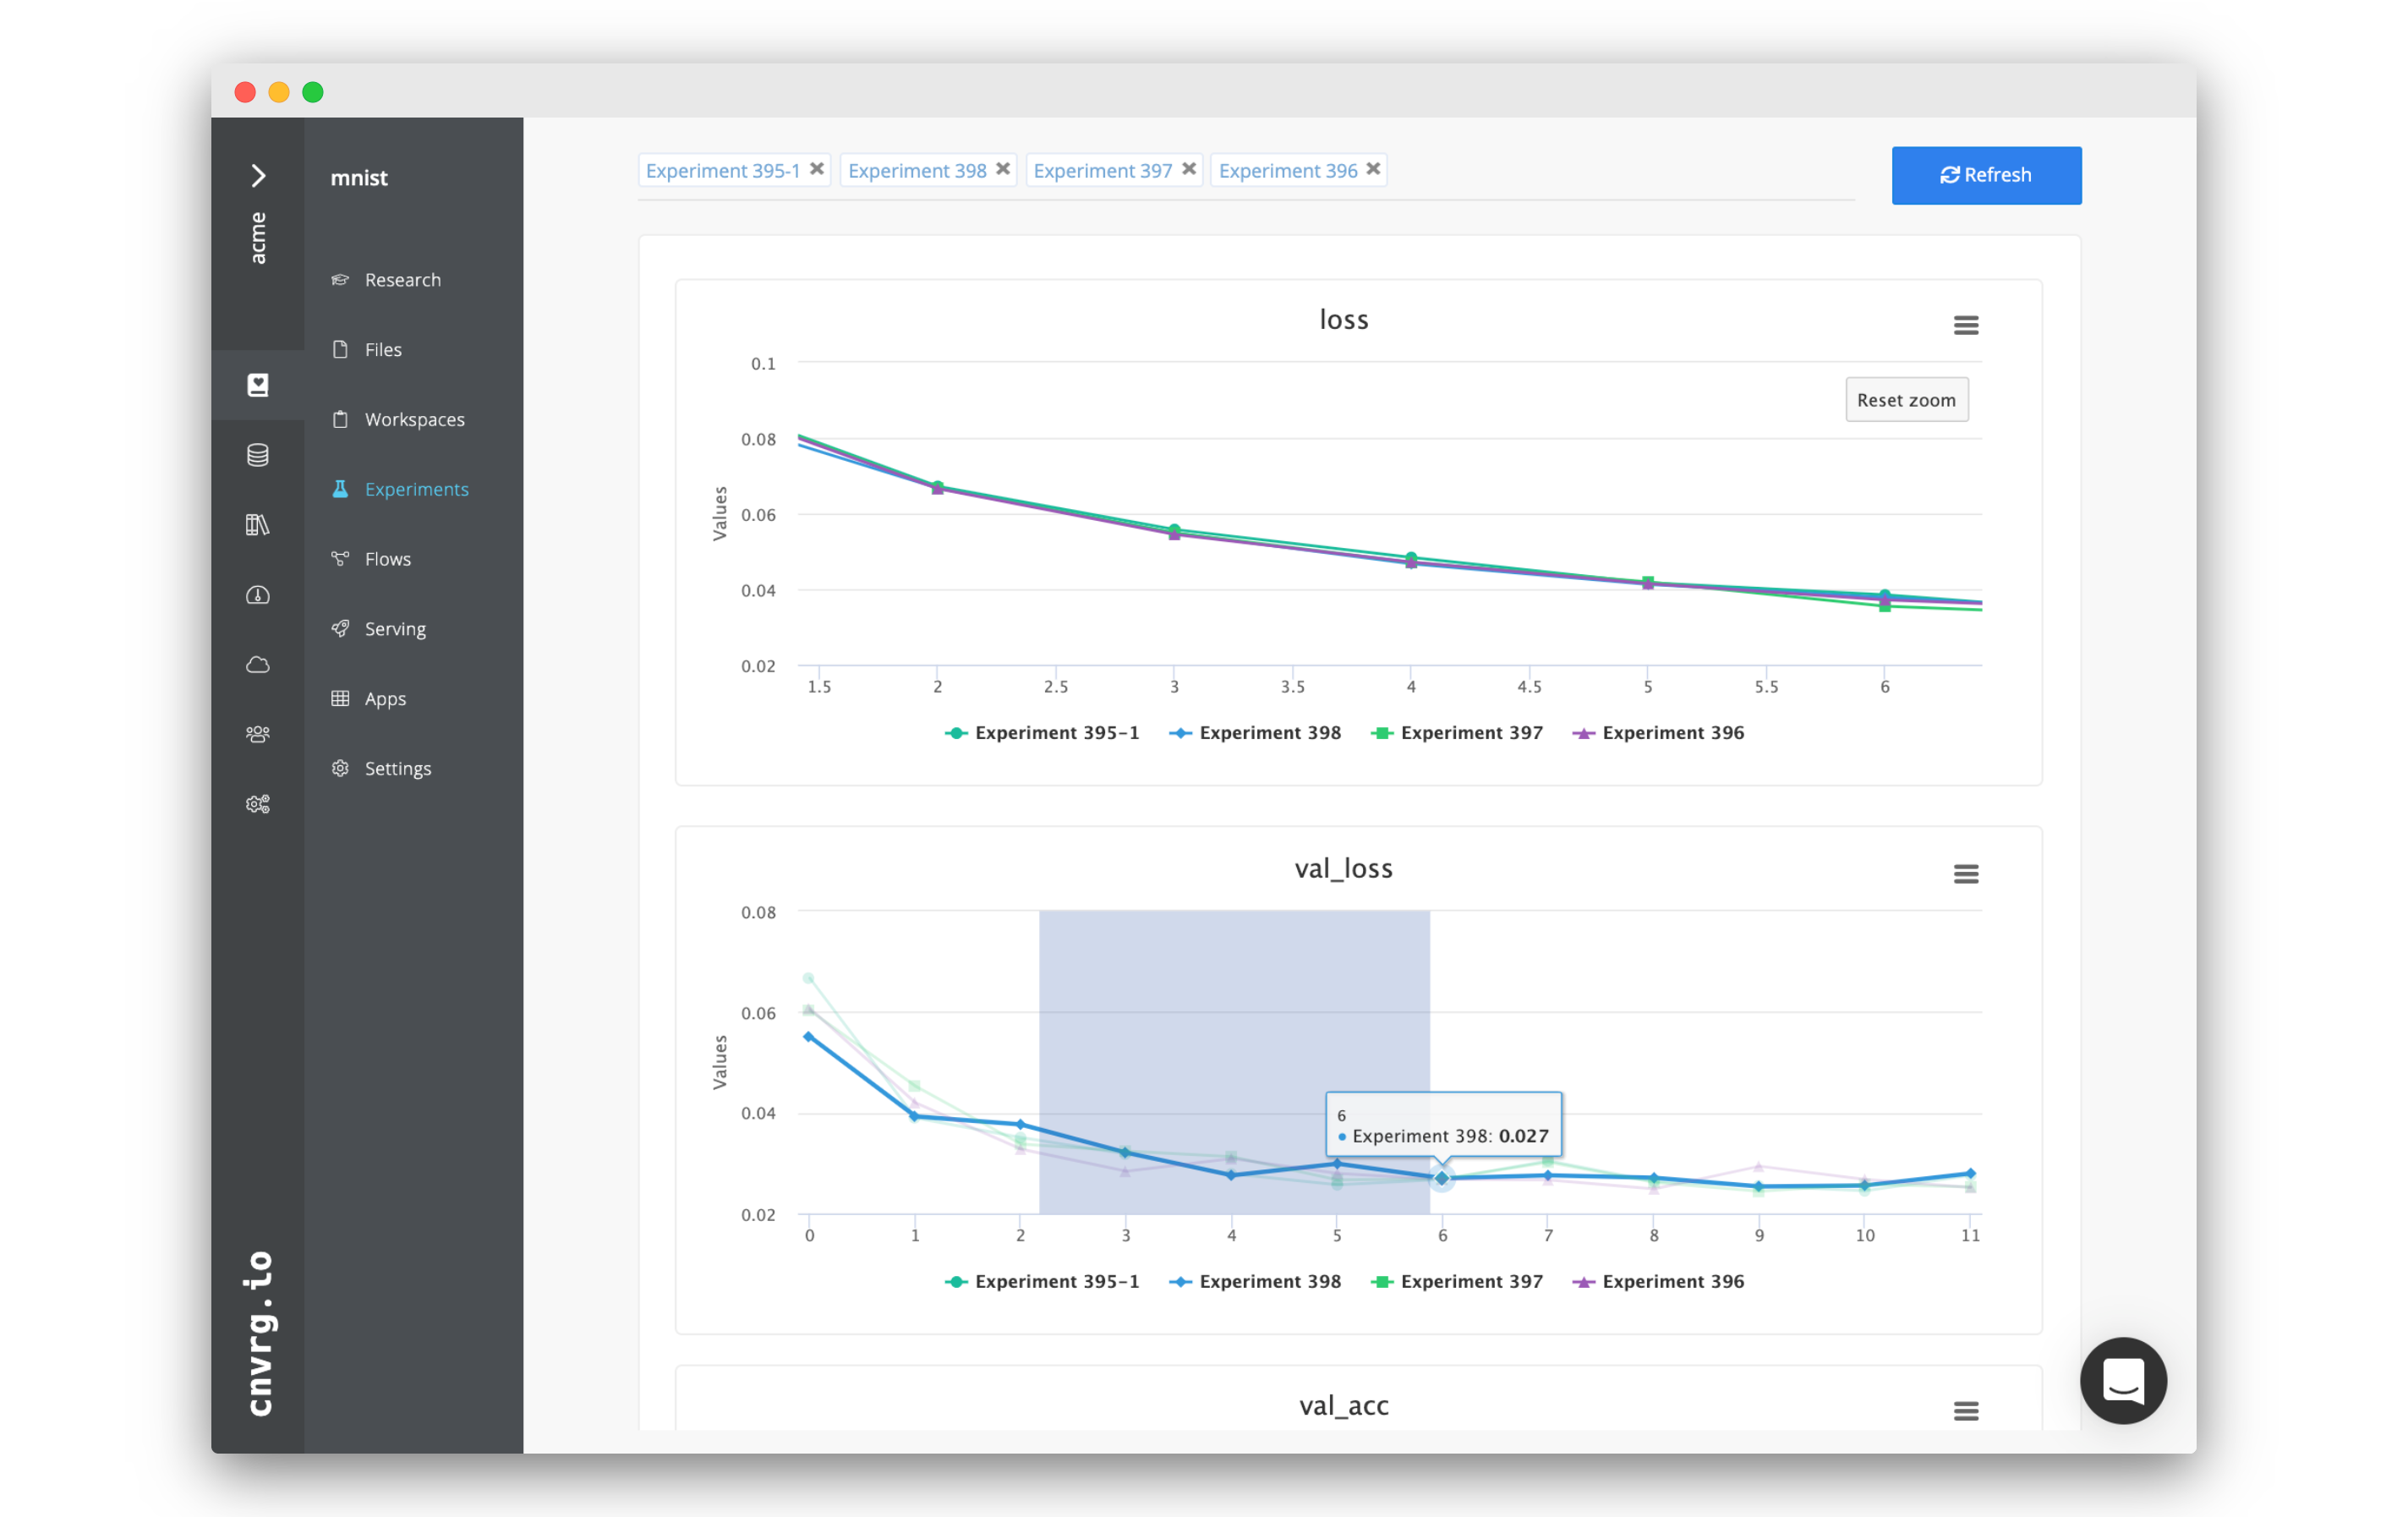
The displayed page shows all of the experiments' metadata and charts alongside each other. Any graphs with matching keys from different experiments are merged into a single graph to simplify comparison.
Click Add Chart to dynamically add additional charts with metadata to the comparison view.
Click Download CSV to export all the comparison metadata, as needed.
To remove experiments from the comparison along the top of the page, click the X next to the experiment to remove it. The page automatically updates, reflecting the change.
NOTE
Confusion matrices, scatter maps, and bar graphs are not currently included in this comparison.
# Compare experiments with TensorBoard

Multiple experiments (completed or active) can also be compared using TensorBoard. In the Experiments page, use the TensorBoard drop-down menu to access currently running TensorBoard comparisons, stop them, or create new ones.
To create a new TensorBoard comparison, click + Start New TensorBoard session. In the dialog, select the experiments, compute, and refresh frequency. Refresh frequency determines the frequency to pull new logs from running experiments. If the experiments are not active, cnvrg fetches their end commit.
TIP
You can mix and match, comparing active and completed experiments on the same TensorBoard dashboard.
Finally, click Start Session and cnvrg starts running the TensorBoard comparison.

TIP
You can also preselect the experiments to compare in the experiments table. They automatically populate the experiments field when creating the comparison.
When the TensorBoard comparison is running, use the menu in the titlebar to perform an action:
- Stop the TensorBoard
- Check the experiments being compared
- Share the comparison
- Display TensorBoard in full-screen mode

NOTE
The TensorBoard comparison feature is currently supported only when running on Kubernetes.
# Troubleshooting Experiments
While cnvrg helps users run their experiments quickly and easily, sometimes experiments fail due to coding errors, incorrect configurations, or problems in the environment. The cnvrg platform helps users resolve these situations quickly without having to rerun the experiment from scratch, saving time and resources.
# Experiment error codes
As with all code, an experiment may fail due to one of many possible errors. If an error is encountered, use the debug mode to quickly resolve issues and restart an experiment. Alternatively, adjust your code as desired, sync the updates to cnvrg or push them to your Git repository, and then rerun the experiment.
Whenever an experiment fails, the command that was run should return an error code, which can provide important information to debug code. The following table lists some typical error codes users may experience:
| Error Code | Explanation |
|---|---|
| 1 | General errors found in the code |
| 2 | Misused shell builtin |
| 126 | An invoked command could not run |
| 127 | An invoked command could not be found |
| 128 | An invalid argument was called to exit |
| 137 | Compute ran out of memory |
| 139 | Invalid memory was called |
# Experiment Debugger

Once an experiment experiences an error, cnvrg sends a Slack or email notification (if configured) informing the user the experiment has failed and has entered Debug mode. The experiment remains live for debugging purposes. When first accessing the Experiments page, a notification displays. The user can either click the Add 15 minutes option or click That's ok, I'm done to not extend time.
By default, the experiment remains live for 30 minutes. However, this default value can be configured in the Organization settings. The countdown displays the time remaining. When the duration expires, cnvrg stops the experiment. To add 15 minutes to the timer, click the Add 15 minutes button.
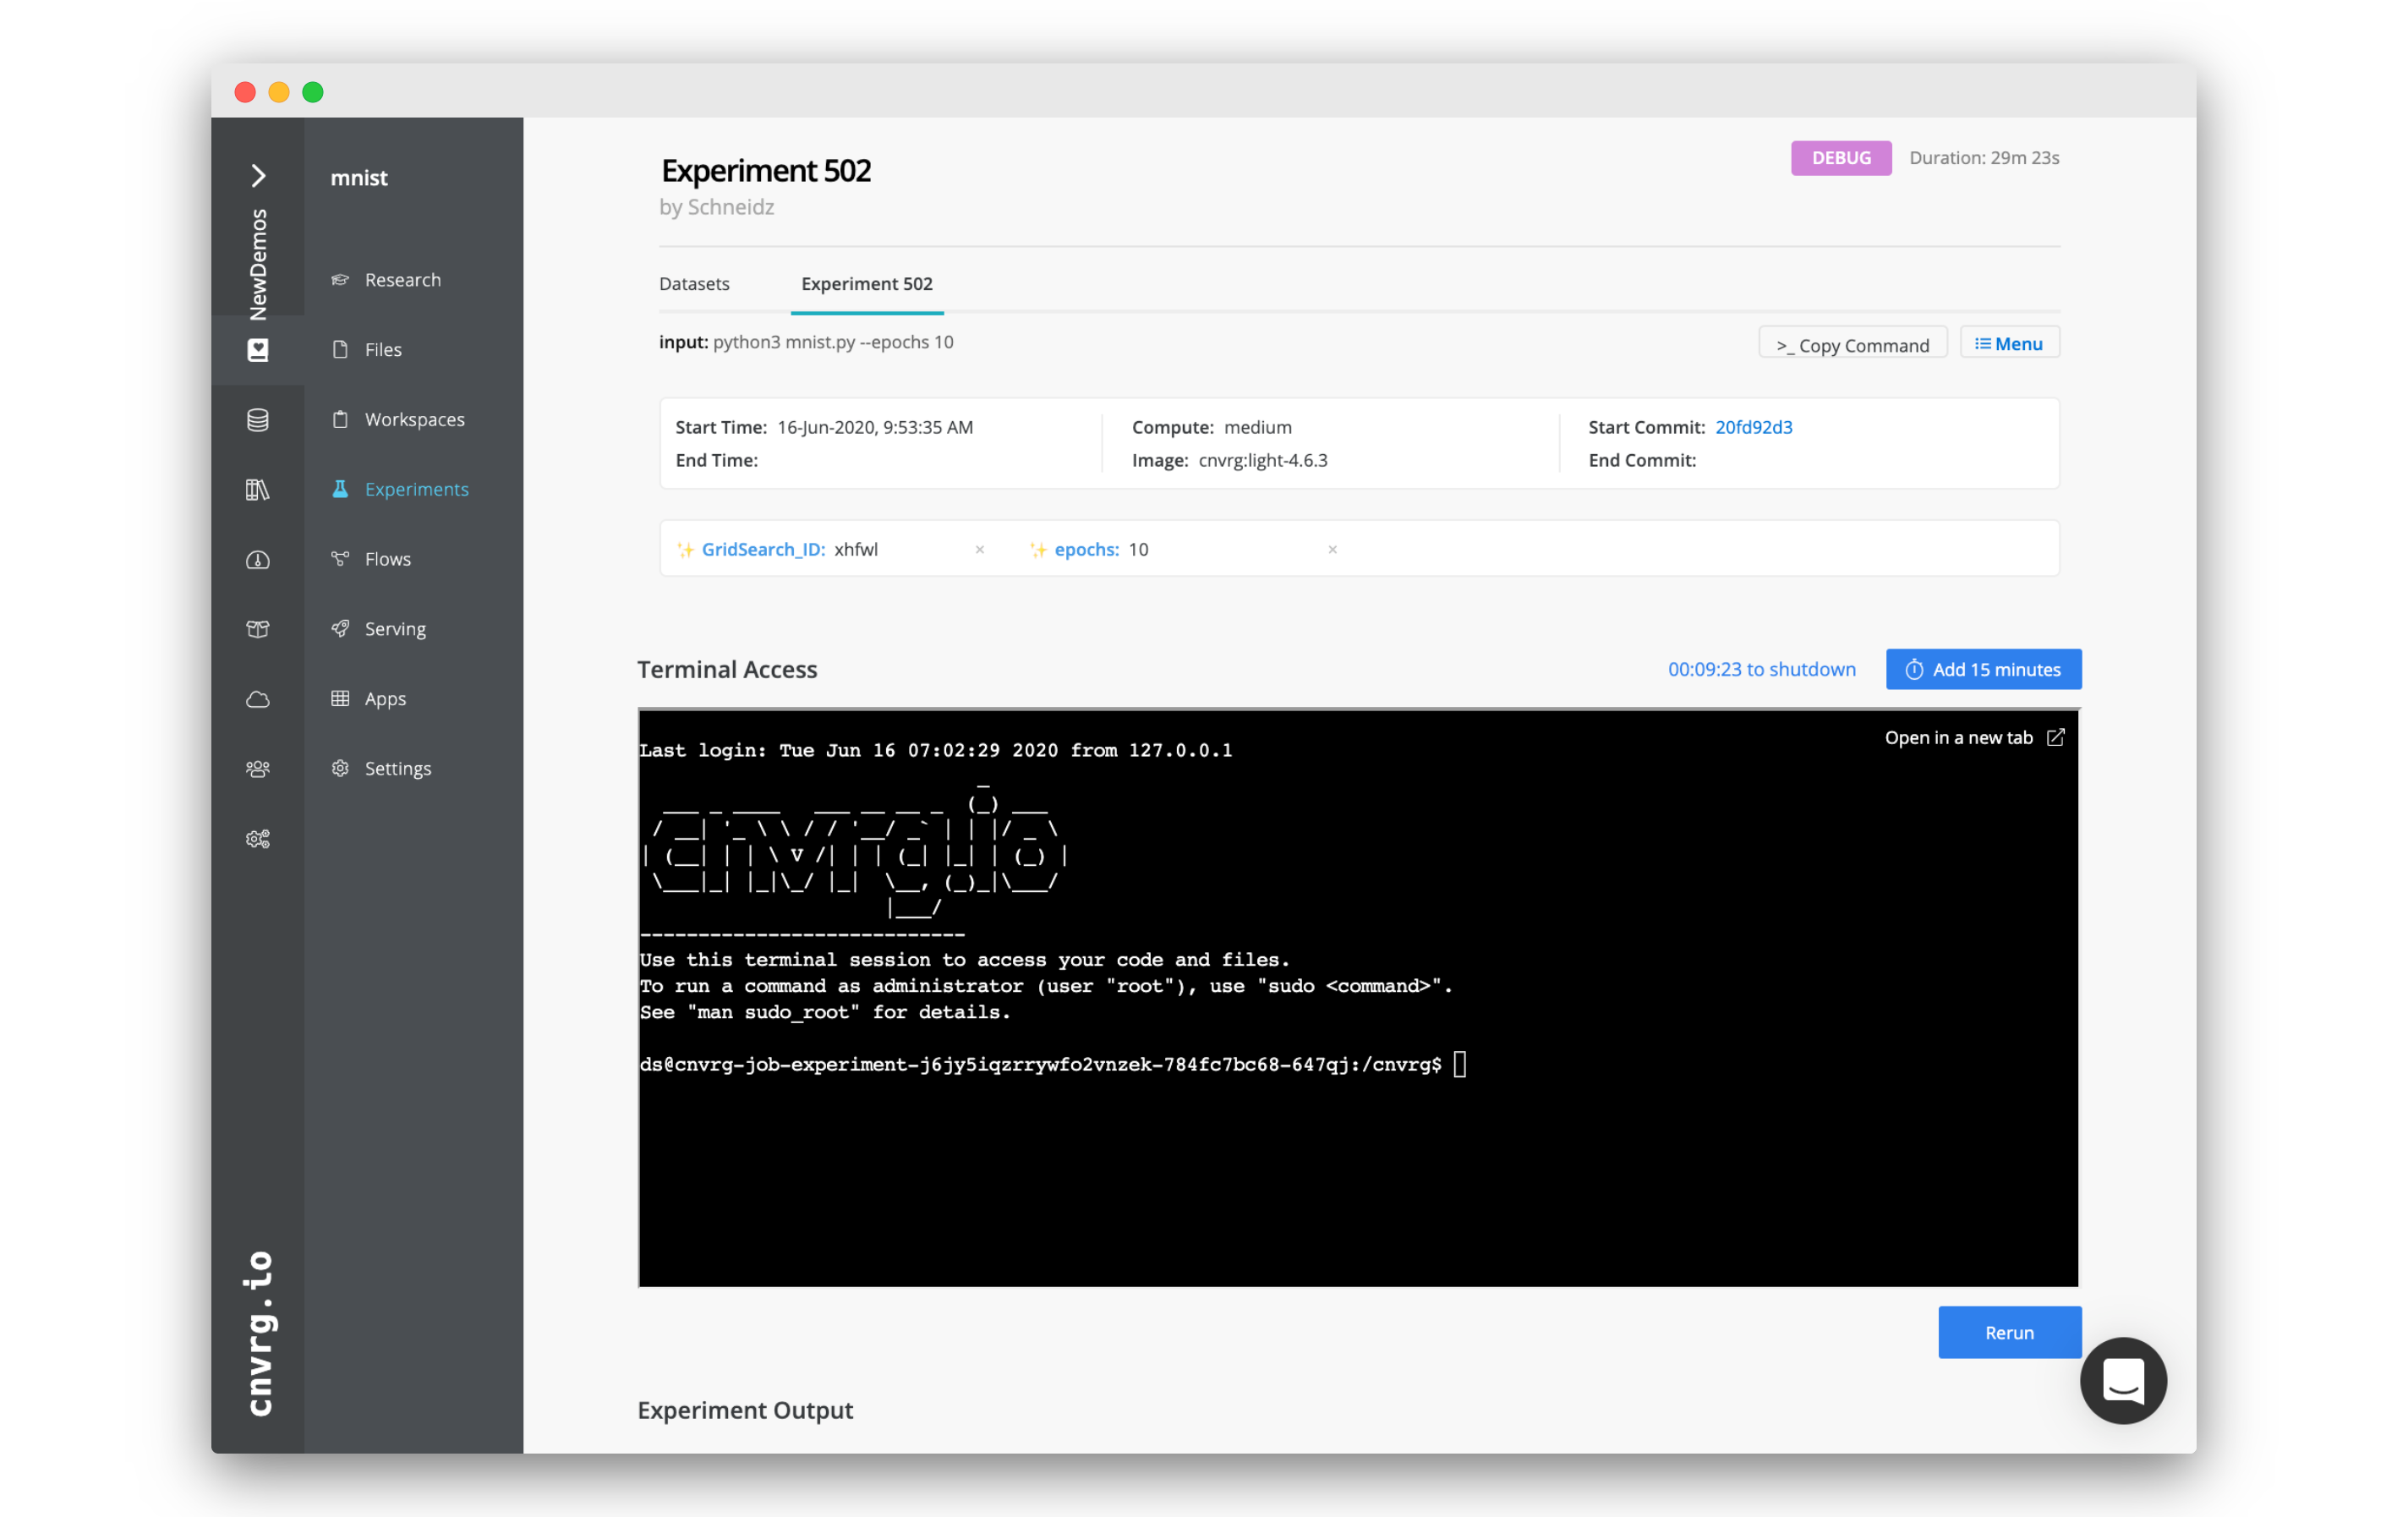 The experiment, compute, and environment can be accessed from a terminal session on the Experiment page. Use the terminal to debug your experiment and fix the error.
When you have finished using the terminal to rectify issues in your code and the environment, click the Rerun button to start the experiment from the beginning without restarting the compute.
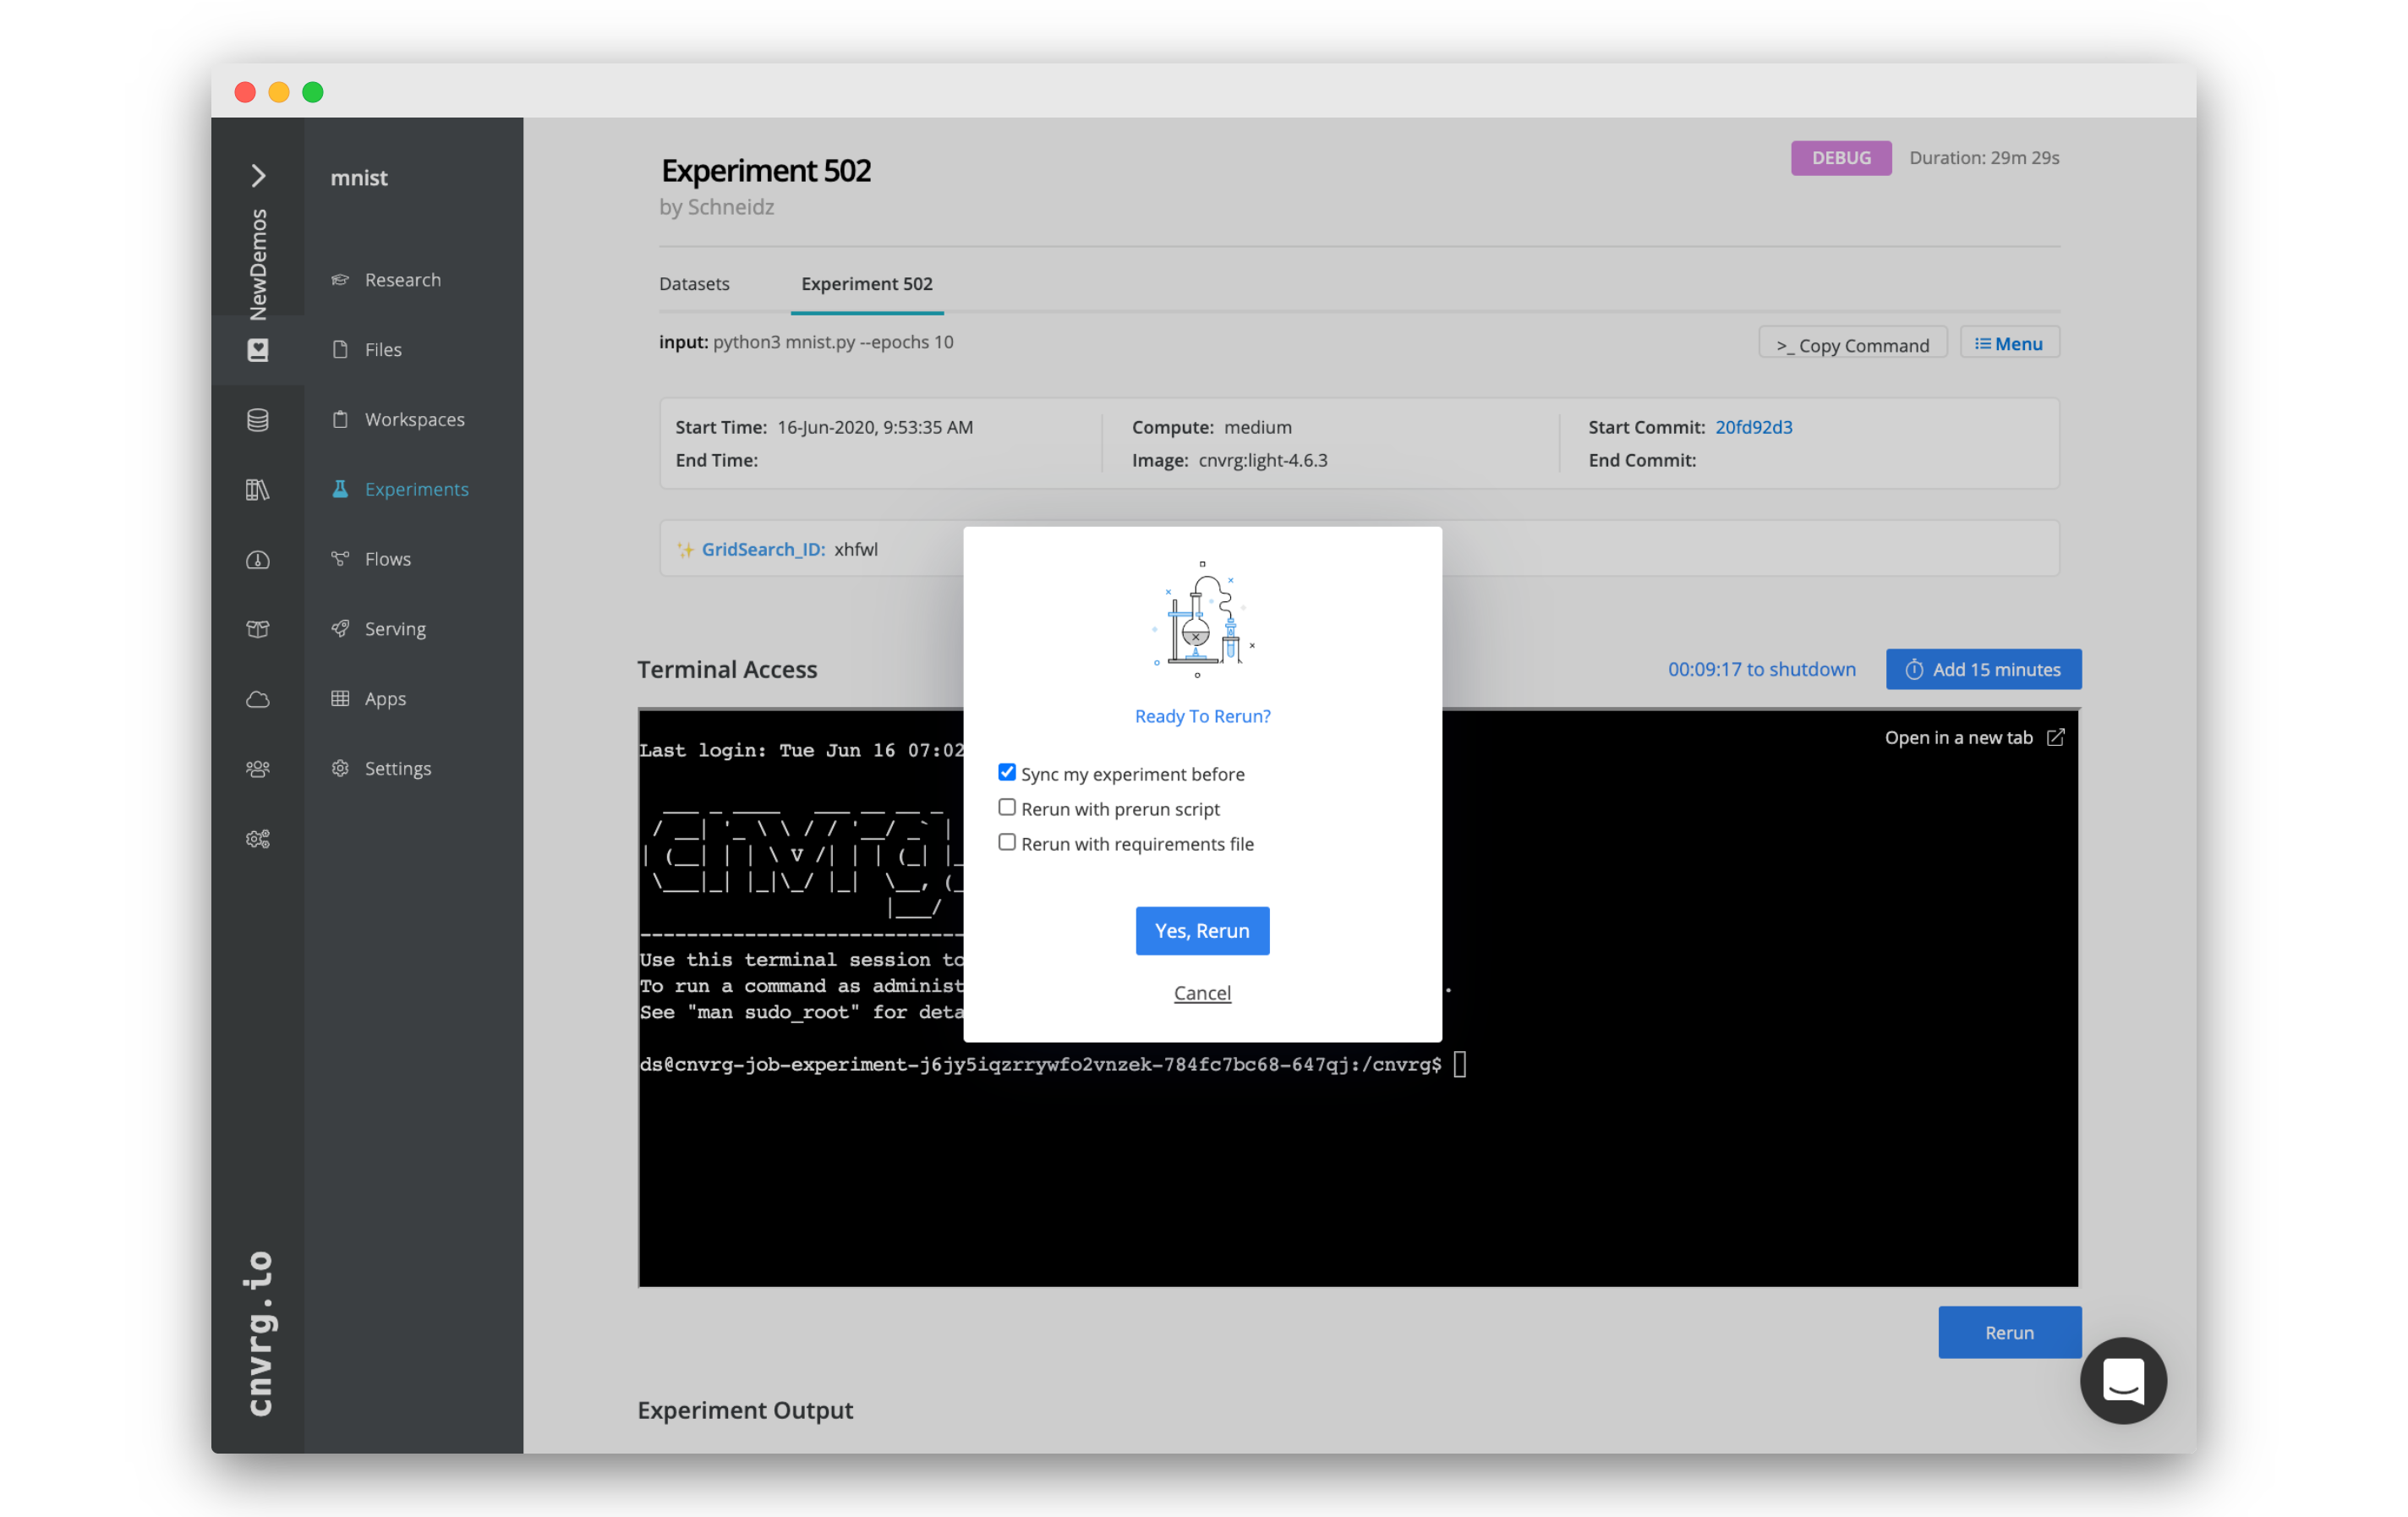
Clicking Rerun provides the options to perform the following:
- Sync my experiment before: Sync changes to the code back to cnvrg before rerunning.
- Rerun with prerun script: Re-execute the
prerun.shscript before running the command. - Rerun with requirements file: Reinstall the packages from the
requirements.txtfile before running the command.
Click Yes, Rerun to confirm your selections and restart the experiment.
TIP
If Slack integration is enabled, it notifies in real time when the experiment enters debug mode. Information to set this up can be found here.

# Using TensorBoard and Terminal
When actively running experiments, cnvrg allows users to use a fully secured terminal to access and interact with the experiment or to use TensorBoard to track live metrics and debug their models.
# TensorBoard
TensorBoard is an open-source application that makes it easier to understand, debug, and optimize TensorFlow programs.
To access an experiment's TensorBoard, click Menu at the top right of the Experiments page and select Open TensorBoard from the drop-down menu. A TensorBoard pages displays.
To stop the TensorBoard from running, click Menu at the top right of the Experiments page and select Stop TensorBoard. After stopping the TensorBoard, restart it again using Menu > Start TensorBoard.
TIP
In the project's settings, you can change the default behavior for whether TensorBoard runs for each experiment. If it is disabled, you can still start it from the Experiments Menu while it runs.
# Terminal
To access the terminal of a machine, instance, or pod the experiment is running on, click Menu at the top right of the Experiments page and select Open Terminal. A new Terminal page displays.

# Performing Other Options
# Export experiments table
To export an experiments table, click the Experiments tab. Three export options are provided:
- Select Export all from the Actions drop-down menu to export all the listed experiments.
- Select the desired experiments from the Actions drop-down menu to export only those.
- Click Menu on the right side of an experiment's row and click Export to export only one experiment.
# View experiments using the CLI
The CLI can be used to interact with experiments, including an at-a-glace viewing of all experiments and deep-diving into one experiment at a time.
To view all experiments, run the following command in the project directory:
cnvrg experiments
To view a specific experiment and check its status and metadata, run the following command:
cnvrg experiments --id ID_OF_EXPERIMENT # e.g Mja3xxhDMVi7AMVEexNs
# View experiment status
An experiment can have one of the following states:
- Pending
- Initializing
- Running
- Success
- Aborted
- Error
- Debug
# Integrate with Slack
A Slack channel can be set up to receive notifications on the status changes for an experiment. Instructions to set up Slack integration are here.
← Workspaces Flows →